| Param | Original file | Final file |
|---|---|---|
| Filename | modeM0/AS1A05_078T01_9000002462cztM0_level2_bc.evt | modeM0/AS1A05_078T01_9000002462cztM0_level2_quad_clean.evt |
| Size (bytes) | 4,168,526,400 | 1,898,225,280 |
| Size | 3.9 GB | 1.8 GB |
| Events in quadrant A | 26,819,350 | 12,792,121 |
| Events in quadrant B | 26,402,555 | 13,181,021 |
| Events in quadrant C | 21,538,197 | 12,631,684 |
| Events in quadrant D | 44,697,595 | 12,060,246 |
| Mode M9 | |||
|---|---|---|---|
| Quadrant | BADHDUFLAG | Total packets | Discarded packets |
| A | 0 | 171 | 0 |
| B | 0 | 171 | 0 |
| C | 0 | 171 | 0 |
| D | 0 | 171 | 0 |
| Mode M0 | |||
|---|---|---|---|
| Quadrant | BADHDUFLAG | Total packets | Discarded packets |
| A | 0 | 234948 | 0 |
| B | 0 | 226557 | 0 |
| C | 0 | 211021 | 0 |
| D | 0 | 290639 | 0 |
| Mode SS | |||
|---|---|---|---|
| Quadrant | BADHDUFLAG | Total packets | Discarded packets |
| A | 0 | 2036 | 0 |
| B | 0 | 2036 | 0 |
| C | 0 | 2036 | 0 |
| D | 0 | 2036 | 0 |
| Quadrant | Total seconds | Saturated seconds | Saturation percentage |
|---|---|---|---|
| A | 99719 | 4099 | 4.110551% |
| B | 99719 | 1739 | 1.743900% |
| C | 99719 | 1482 | 1.486176% |
| D | 99719 | 4977 | 4.991025% |
Noise dominated data is calculated using 1-second bins in cleaned event files. If a bin has >2000 counts, and if more than 50% of those come from <1% of pixels, then it is considered to be noise-dominated and hence unusable.
| Quadrant | # 1 sec bins | Bins with >0 counts | Bins with >2000 counts | High rate bins dominated by noise | Noise dominated (total time) | Noise dominated (detector-on time) | Marked lightcurve |
|---|---|---|---|---|---|---|---|
| A | 117005 | 99716 | 278 | 278 | 0.24% | 0.28% |  |
| B | 117005 | 99720 | 33 | 33 | 0.03% | 0.03% |  |
| C | 117005 | 99722 | 0 | 0 | 0.00% | 0.00% |  |
| D | 117005 | 99719 | 899 | 899 | 0.77% | 0.90% |  |
Top three noisy pixels from each quadrant. If the there are fewer than three noisy pixels in the level2.evt file, extra rows are filled as -1
| Pixel properties | Quadrant properties | ||||||
|---|---|---|---|---|---|---|---|
| Quadrant | DetID | PixID | Counts | Sigma | Mean | Median | Sigma |
| A | 15 | 174 | 6113891 | 5484.2 | 5156 | 5071 | 1113.9 |
| A | 9 | 143 | 546561 | 486.12 | 5156 | 5071 | 1113.9 |
| A | 3 | 1 | 276521 | 243.69 | 5156 | 5071 | 1113.9 |
| B | 15 | 35 | 1853689 | 1875.33 | 5288 | 5174 | 985.7 |
| B | 0 | 229 | 1288942 | 1302.39 | 5288 | 5174 | 985.7 |
| B | 0 | 189 | 775018 | 781.01 | 5288 | 5174 | 985.7 |
| C | 3 | 233 | 1851449 | 1563.31 | 5033 | 5017 | 1181.1 |
| C | 7 | 247 | 253809 | 210.64 | 5033 | 5017 | 1181.1 |
| C | 5 | 237 | 53784 | 41.29 | 5033 | 5017 | 1181.1 |
| D | 1 | 52 | 15612689 | 13295.93 | 5056 | 4891 | 1173.9 |
| D | 2 | 16 | 4128388 | 3512.71 | 5056 | 4891 | 1173.9 |
| D | 15 | 0 | 2561652 | 2178.05 | 5056 | 4891 | 1173.9 |
Histogram calculated using DETX and DETY for each event in the final _common_clean file
| Quadrant A |  |
 |
Quadrant B |
|---|---|---|---|
| Quadrant D |  |
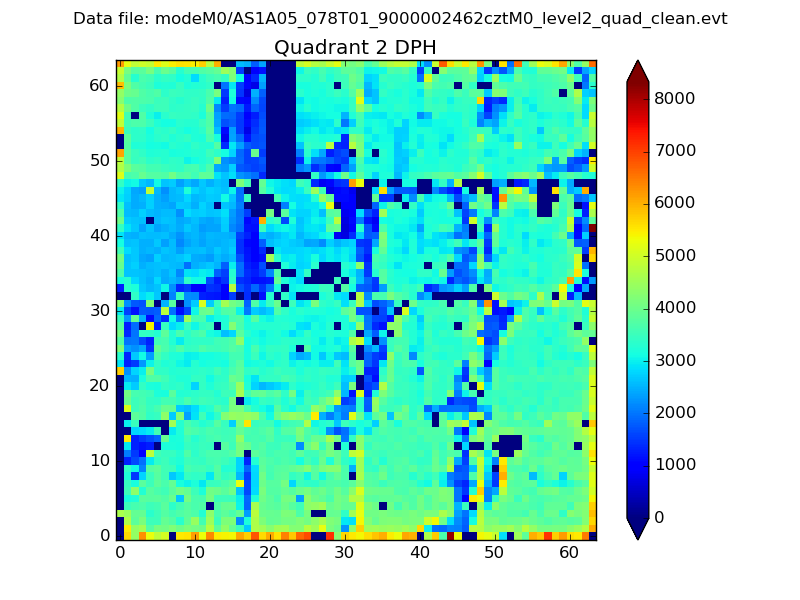 |
Quadrant C |
| Plot type | Count rate plots | Images |
|---|---|---|
| Comparison with Poisson distribution Blue bars denote a histogram of data divided into 1 sec bins. Red curve is a Poisson curve with rate = median count rate of data. |
 |
 |
| Quadrant-wise count rates Data is divided into 100 sec bins |
 |
|
| Module-wise count rates for Quadrant A Data is divided into 100 sec bins |
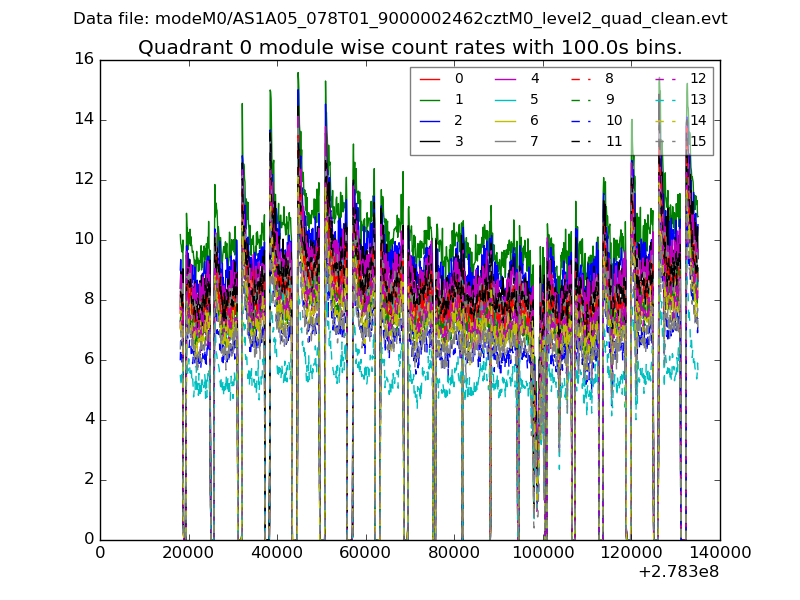 |
 |
| Module-wise count rates for Quadrant B Data is divided into 100 sec bins |
 |
 |
| Module-wise count rates for Quadrant C Data is divided into 100 sec bins |
 |
 |
| Module-wise count rates for Quadrant D Data is divided into 100 sec bins |
 |
 |
| Parameter | Plot |
|---|---|
| CZT HV Monitor |  |
| D_VDD |  |
| Temperature 1 | 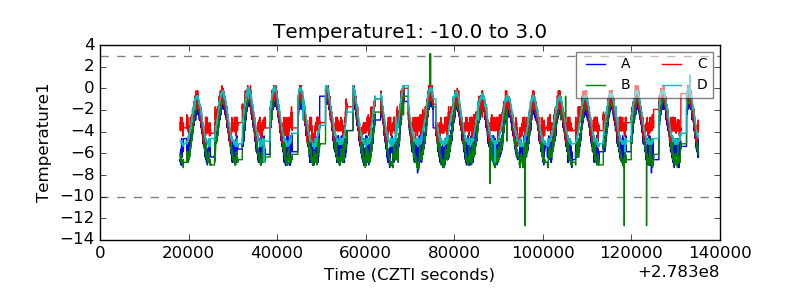 |
| Veto HV Monitor | 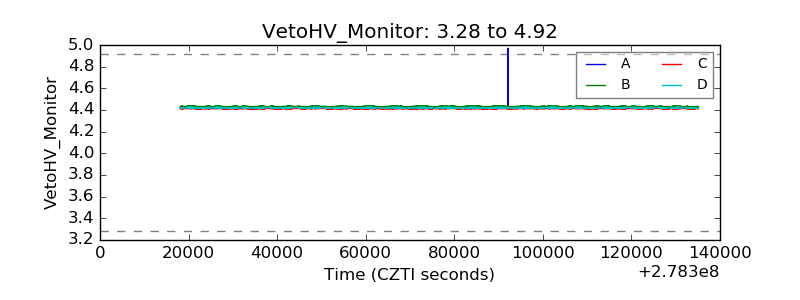 |
| Veto LLD |  |
| Alpha Counter |  |
| _CPM_Rate |  |
| CZT Counter |  |
| +2.5 Volts monitor | 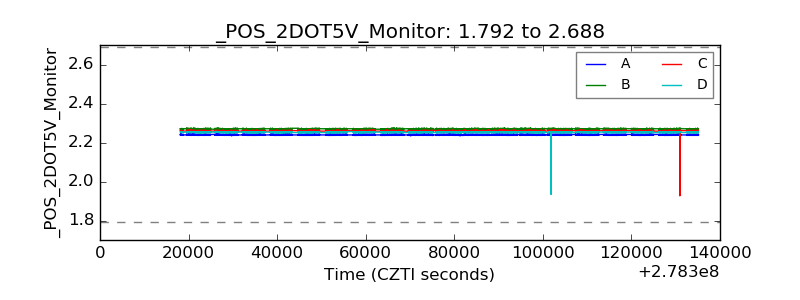 |
| +5 Volts monitor |  |
| _ROLL_ROT |  |
| _Roll_DEC |  |
| _Roll_RA | 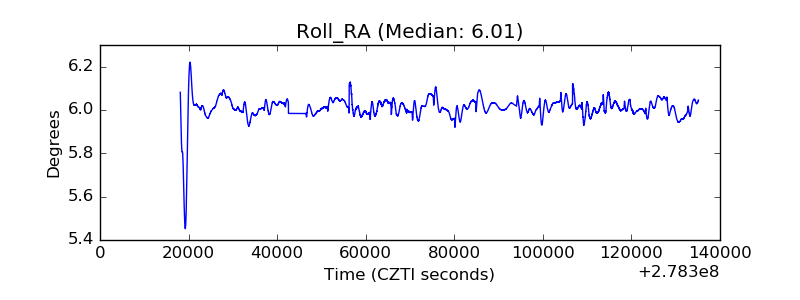 |
| Veto Counter |  |