| Param | Original file | Final file |
|---|---|---|
| Filename | modeM0/AS1C04_007T07_9000002452cztM0_level2_bc.evt | modeM0/AS1C04_007T07_9000002452cztM0_level2_quad_clean.evt |
| Size (bytes) | 1,595,592,000 | 515,059,200 |
| Size | 1.5 GB | 491.2 MB |
| Events in quadrant A | 9,599,243 | 3,241,854 |
| Events in quadrant B | 9,329,027 | 3,311,143 |
| Events in quadrant C | 13,282,163 | 3,110,847 |
| Events in quadrant D | 13,339,994 | 3,145,848 |
| Mode SS | |||
|---|---|---|---|
| Quadrant | BADHDUFLAG | Total packets | Discarded packets |
| A | 0 | 826 | 0 |
| B | 0 | 826 | 0 |
| C | 0 | 826 | 0 |
| D | 0 | 826 | 0 |
| Mode M9 | |||
|---|---|---|---|
| Quadrant | BADHDUFLAG | Total packets | Discarded packets |
| A | 0 | 42 | 0 |
| B | 0 | 42 | 0 |
| C | 0 | 42 | 0 |
| D | 0 | 42 | 0 |
| Mode M0 | |||
|---|---|---|---|
| Quadrant | BADHDUFLAG | Total packets | Discarded packets |
| A | 0 | 90779 | 0 |
| B | 0 | 88420 | 0 |
| C | 0 | 100275 | 0 |
| D | 0 | 100326 | 0 |
| Quadrant | Total seconds | Saturated seconds | Saturation percentage |
|---|---|---|---|
| A | 40636 | 1119 | 2.753716% |
| B | 40636 | 648 | 1.594645% |
| C | 40636 | 2599 | 6.395807% |
| D | 40636 | 1034 | 2.544542% |
Noise dominated data is calculated using 1-second bins in cleaned event files. If a bin has >2000 counts, and if more than 50% of those come from <1% of pixels, then it is considered to be noise-dominated and hence unusable.
| Quadrant | # 1 sec bins | Bins with >0 counts | Bins with >2000 counts | High rate bins dominated by noise | Noise dominated (total time) | Noise dominated (detector-on time) | Marked lightcurve |
|---|---|---|---|---|---|---|---|
| A | 44882 | 40639 | 17 | 17 | 0.04% | 0.04% |  |
| B | 44882 | 40638 | 2 | 2 | 0.00% | 0.00% | 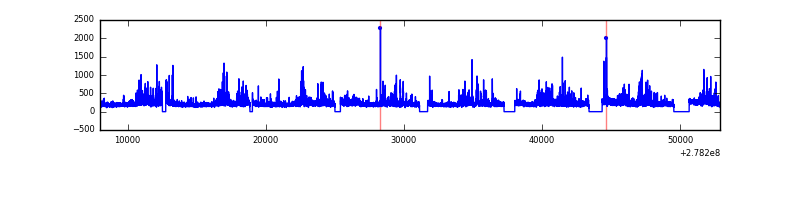 |
| C | 44882 | 40635 | 825 | 825 | 1.84% | 2.03% |  |
| D | 44882 | 40636 | 191 | 191 | 0.43% | 0.47% |  |
Top three noisy pixels from each quadrant. If the there are fewer than three noisy pixels in the level2.evt file, extra rows are filled as -1
| Pixel properties | Quadrant properties | ||||||
|---|---|---|---|---|---|---|---|
| Quadrant | DetID | PixID | Counts | Sigma | Mean | Median | Sigma |
| A | 15 | 174 | 1398016 | 3176.85 | 2013 | 1970 | 439.4 |
| A | 3 | 1 | 334365 | 756.4 | 2013 | 1970 | 439.4 |
| A | 12 | 96 | 71047 | 157.19 | 2013 | 1970 | 439.4 |
| B | 15 | 35 | 462476 | 1176.46 | 2048 | 1990 | 391.4 |
| B | 0 | 198 | 261272 | 662.42 | 2048 | 1990 | 391.4 |
| B | 4 | 216 | 171344 | 432.67 | 2048 | 1990 | 391.4 |
| C | 7 | 247 | 4450583 | 9859.91 | 1927 | 1911 | 451.2 |
| C | 3 | 233 | 1358474 | 3006.65 | 1927 | 1911 | 451.2 |
| C | 0 | 207 | 36568 | 76.81 | 1927 | 1911 | 451.2 |
| D | 1 | 52 | 4923212 | 10574.05 | 2004 | 1929 | 465.4 |
| D | 5 | 222 | 314263 | 671.09 | 2004 | 1929 | 465.4 |
| D | 10 | 70 | 188844 | 401.61 | 2004 | 1929 | 465.4 |
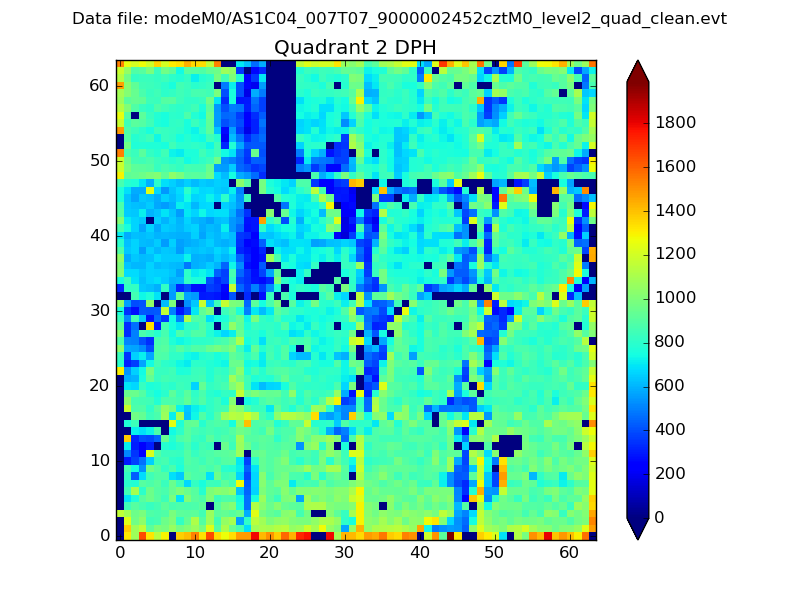
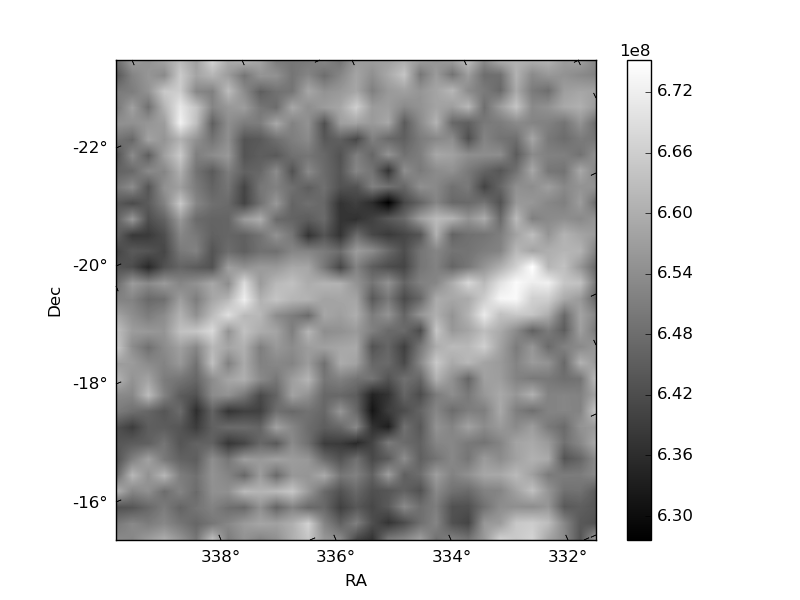
Histogram calculated using DETX and DETY for each event in the final _common_clean file
| Quadrant A | 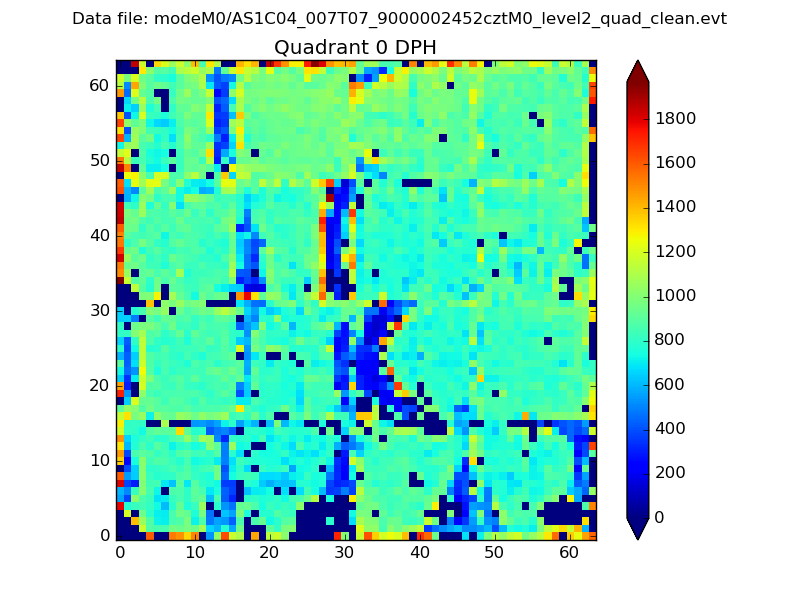 |
 |
Quadrant B |
|---|---|---|---|
| Quadrant D |  |
 |
Quadrant C |
| Plot type | Count rate plots | Images |
|---|---|---|
| Comparison with Poisson distribution Blue bars denote a histogram of data divided into 1 sec bins. Red curve is a Poisson curve with rate = median count rate of data. |
 |
 |
| Quadrant-wise count rates Data is divided into 100 sec bins |
 |
|
| Module-wise count rates for Quadrant A Data is divided into 100 sec bins |
 |
 |
| Module-wise count rates for Quadrant B Data is divided into 100 sec bins |
 |
 |
| Module-wise count rates for Quadrant C Data is divided into 100 sec bins |
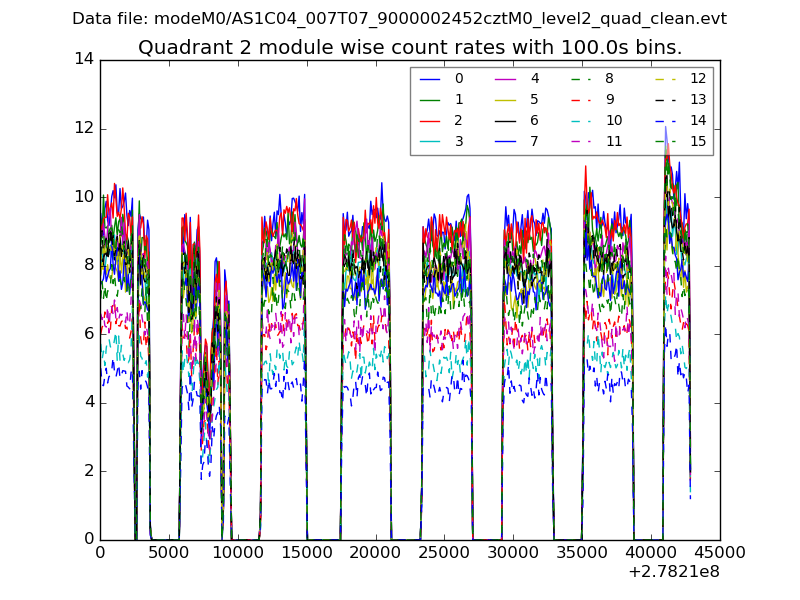 |
 |
| Module-wise count rates for Quadrant D Data is divided into 100 sec bins |
 |
 |
| Parameter | Plot |
|---|---|
| CZT HV Monitor |  |
| D_VDD | 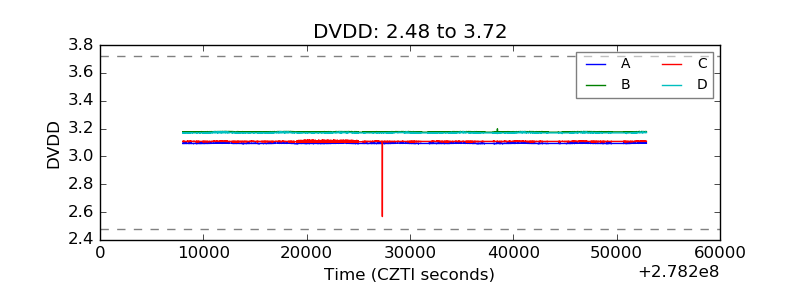 |
| Temperature 1 | 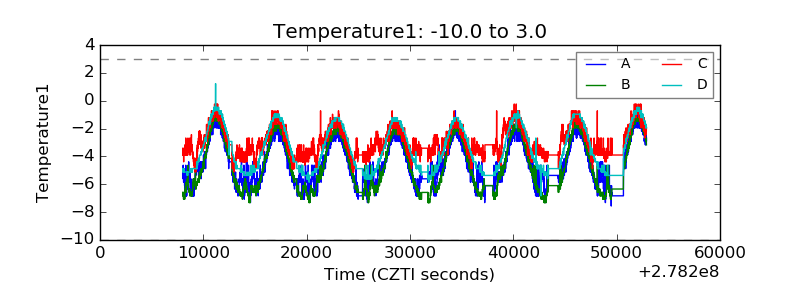 |
| Veto HV Monitor |  |
| Veto LLD |  |
| Alpha Counter |  |
| _CPM_Rate |  |
| CZT Counter | 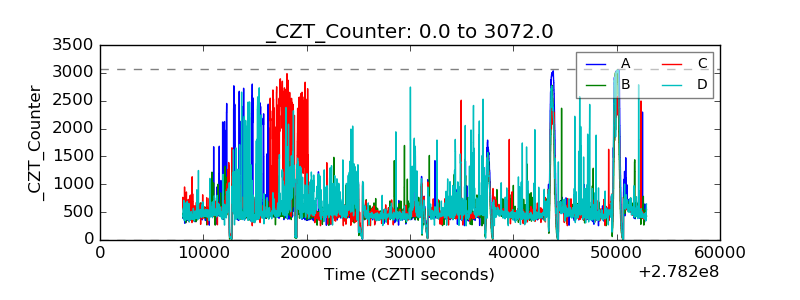 |
| +2.5 Volts monitor | 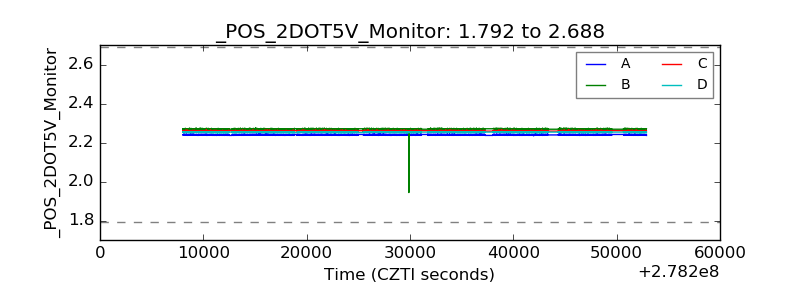 |
| +5 Volts monitor |  |
| _ROLL_ROT | 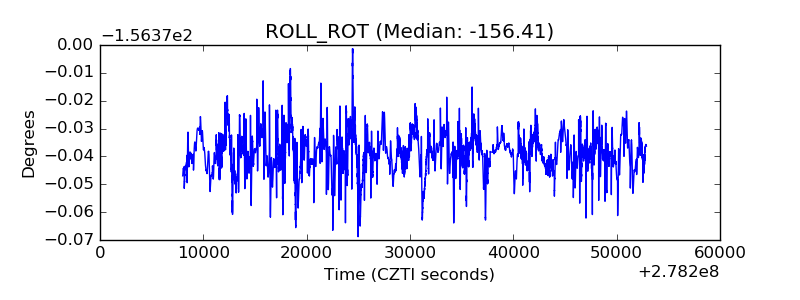 |
| _Roll_DEC |  |
| _Roll_RA | 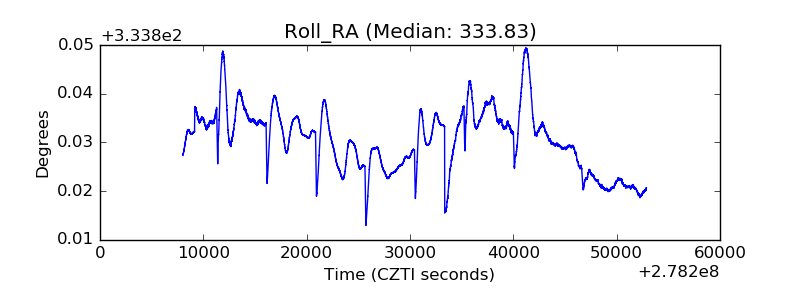 |
| Veto Counter |  |