| Param | Original file | Final file |
|---|---|---|
| Filename | modeM0/AS1A05_002T10_9000002460cztM0_level2_bc.evt | modeM0/AS1A05_002T10_9000002460cztM0_level2_quad_clean.evt |
| Size (bytes) | 1,016,124,480 | 366,465,600 |
| Size | 969.1 MB | 349.5 MB |
| Events in quadrant A | 6,240,704 | 2,344,599 |
| Events in quadrant B | 6,006,452 | 2,409,331 |
| Events in quadrant C | 5,374,233 | 2,289,804 |
| Events in quadrant D | 11,303,433 | 2,195,180 |
| Mode M0 | |||
|---|---|---|---|
| Quadrant | BADHDUFLAG | Total packets | Discarded packets |
| A | 0 | 58060 | 0 |
| B | 0 | 57858 | 0 |
| C | 0 | 55340 | 0 |
| D | 0 | 76603 | 0 |
| Mode SS | |||
|---|---|---|---|
| Quadrant | BADHDUFLAG | Total packets | Discarded packets |
| A | 0 | 550 | 0 |
| B | 0 | 550 | 0 |
| C | 0 | 550 | 0 |
| D | 0 | 550 | 0 |
| Mode M9 | |||
|---|---|---|---|
| Quadrant | BADHDUFLAG | Total packets | Discarded packets |
| A | 0 | 13 | 0 |
| B | 0 | 13 | 0 |
| C | 0 | 13 | 0 |
| D | 0 | 13 | 0 |
| Quadrant | Total seconds | Saturated seconds | Saturation percentage |
|---|---|---|---|
| A | 27054 | 390 | 1.441561% |
| B | 27054 | 270 | 0.998004% |
| C | 27054 | 295 | 1.090412% |
| D | 27054 | 1359 | 5.023287% |
Noise dominated data is calculated using 1-second bins in cleaned event files. If a bin has >2000 counts, and if more than 50% of those come from <1% of pixels, then it is considered to be noise-dominated and hence unusable.
| Quadrant | # 1 sec bins | Bins with >0 counts | Bins with >2000 counts | High rate bins dominated by noise | Noise dominated (total time) | Noise dominated (detector-on time) | Marked lightcurve |
|---|---|---|---|---|---|---|---|
| A | 28410 | 27056 | 116 | 116 | 0.41% | 0.43% |  |
| B | 28410 | 27055 | 1 | 1 | 0.00% | 0.00% |  |
| C | 28410 | 27057 | 0 | 0 | 0.00% | 0.00% | 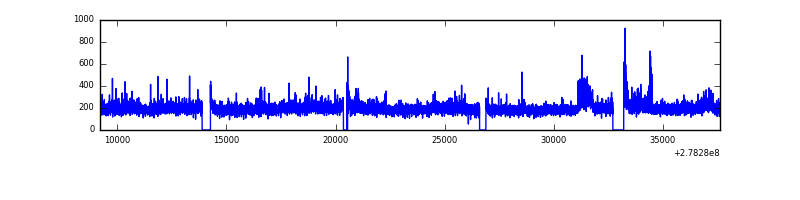 |
| D | 28410 | 27054 | 241 | 241 | 0.85% | 0.89% |  |
Top three noisy pixels from each quadrant. If the there are fewer than three noisy pixels in the level2.evt file, extra rows are filled as -1
| Pixel properties | Quadrant properties | ||||||
|---|---|---|---|---|---|---|---|
| Quadrant | DetID | PixID | Counts | Sigma | Mean | Median | Sigma |
| A | 9 | 143 | 857424 | 2960.02 | 1314 | 1285 | 289.2 |
| A | 12 | 96 | 182580 | 626.81 | 1314 | 1285 | 289.2 |
| A | 3 | 1 | 130130 | 445.47 | 1314 | 1285 | 289.2 |
| B | 15 | 35 | 252005 | 977.07 | 1337 | 1302 | 256.6 |
| B | 0 | 189 | 187811 | 726.88 | 1337 | 1302 | 256.6 |
| B | 0 | 198 | 143538 | 554.34 | 1337 | 1302 | 256.6 |
| C | 3 | 233 | 382153 | 1242.95 | 1282 | 1269 | 306.4 |
| C | 7 | 247 | 46897 | 148.9 | 1282 | 1269 | 306.4 |
| C | 14 | 67 | 11738 | 34.16 | 1282 | 1269 | 306.4 |
| D | 1 | 52 | 3133127 | 10200.52 | 1283 | 1237 | 307.0 |
| D | 2 | 16 | 2523520 | 8215.04 | 1283 | 1237 | 307.0 |
| D | 10 | 70 | 284215 | 921.66 | 1283 | 1237 | 307.0 |
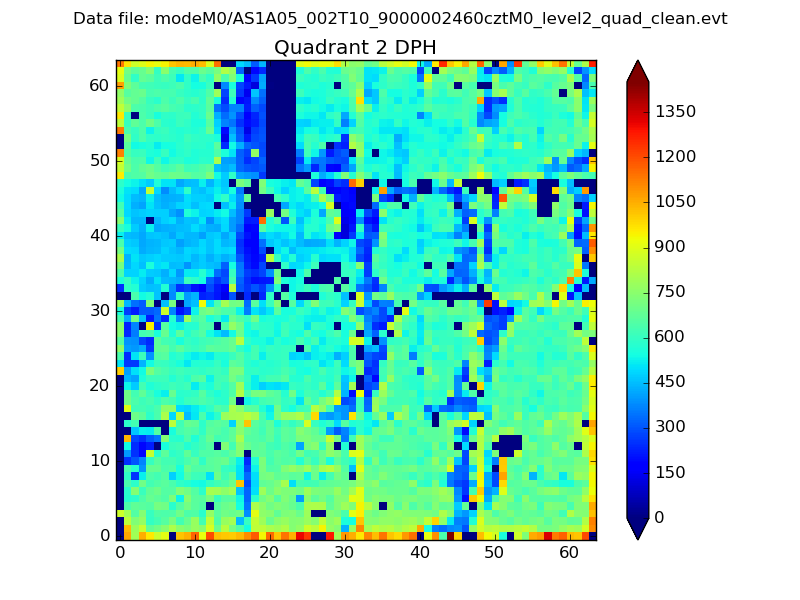
Histogram calculated using DETX and DETY for each event in the final _common_clean file
| Quadrant A |  |
 |
Quadrant B |
|---|---|---|---|
| Quadrant D |  |
 |
Quadrant C |
| Plot type | Count rate plots | Images |
|---|---|---|
| Comparison with Poisson distribution Blue bars denote a histogram of data divided into 1 sec bins. Red curve is a Poisson curve with rate = median count rate of data. |
 |
 |
| Quadrant-wise count rates Data is divided into 100 sec bins |
 |
|
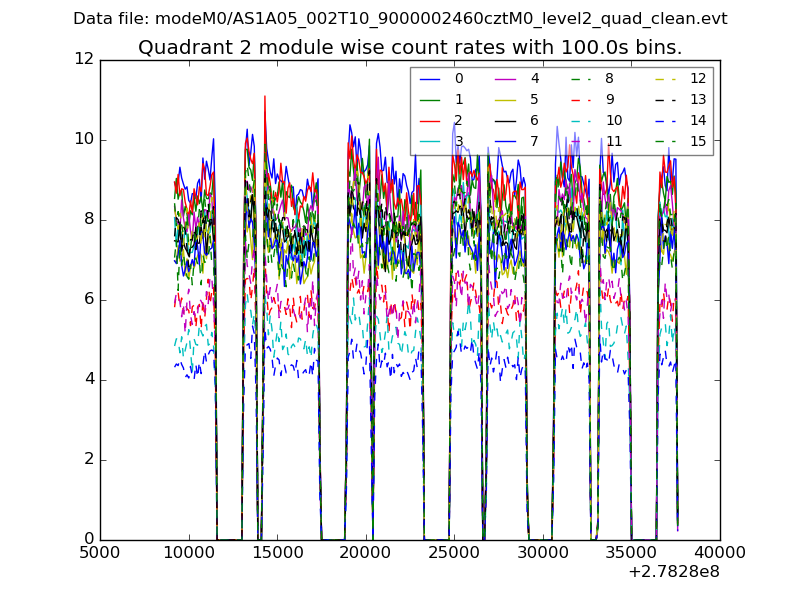
| Module-wise count rates for Quadrant A Data is divided into 100 sec bins |
 |
 |
| Module-wise count rates for Quadrant B Data is divided into 100 sec bins |
 |
 |
| Module-wise count rates for Quadrant C Data is divided into 100 sec bins |
 |
 |
| Module-wise count rates for Quadrant D Data is divided into 100 sec bins |
 |
 |
| Parameter | Plot |
|---|---|
| CZT HV Monitor |  |
| D_VDD | 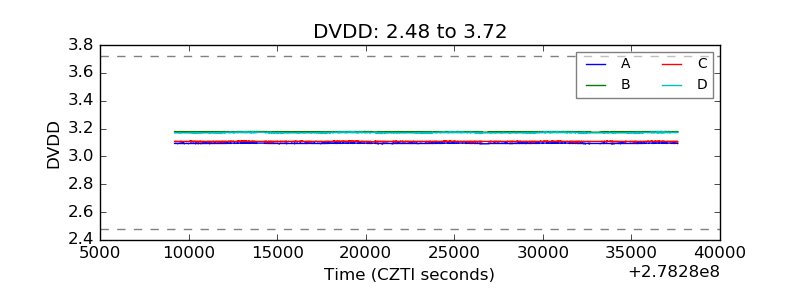 |
| Temperature 1 |  |
| Veto HV Monitor |  |
| Veto LLD |  |
| Alpha Counter |  |
| _CPM_Rate |  |
| CZT Counter | 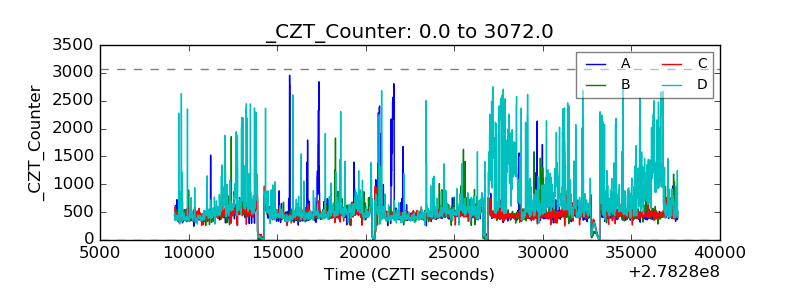 |
| +2.5 Volts monitor |  |
| +5 Volts monitor |  |
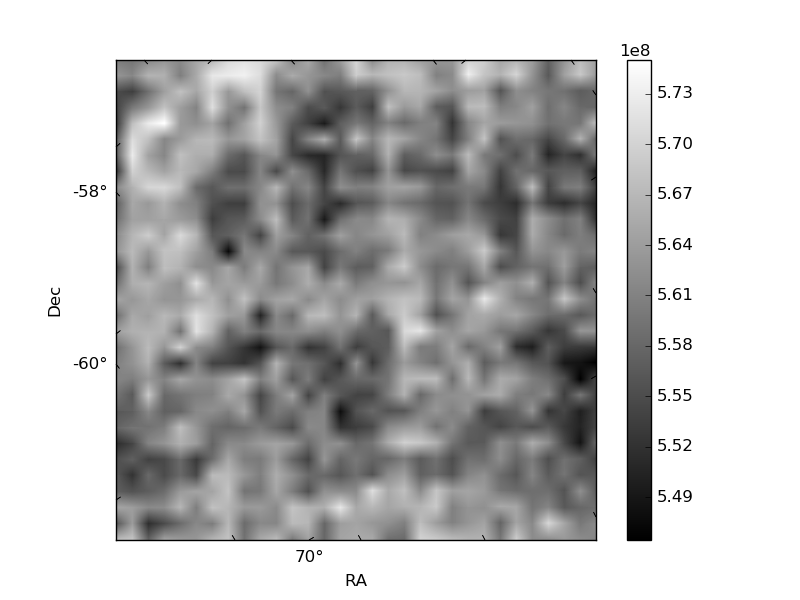
| _ROLL_ROT | 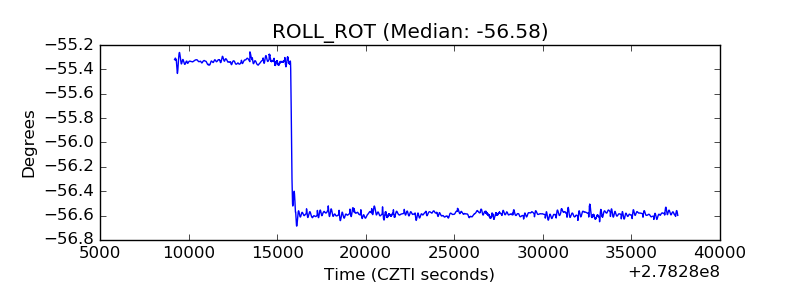 |
| _Roll_DEC | 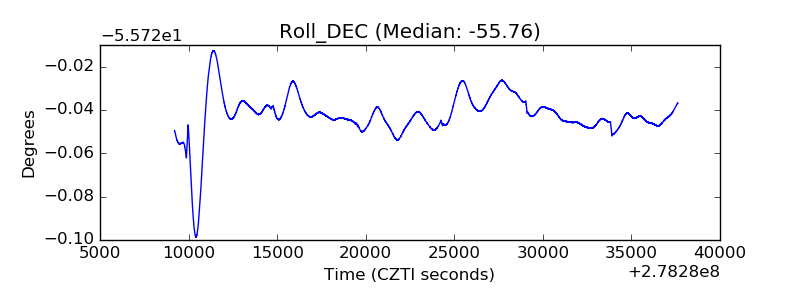 |
| _Roll_RA |  |
| Veto Counter |  |