| Param | Original file | Final file |
|---|---|---|
| Filename | modeM0/AS1A05_002T09_9000002456cztM0_level2_bc.evt | modeM0/AS1A05_002T09_9000002456cztM0_level2_quad_clean.evt |
| Size (bytes) | 301,006,080 | 140,238,720 |
| Size | 287.1 MB | 133.7 MB |
| Events in quadrant A | 1,841,080 | 951,319 |
| Events in quadrant B | 2,265,899 | 970,568 |
| Events in quadrant C | 2,369,452 | 902,321 |
| Events in quadrant D | 2,109,010 | 889,156 |
| Mode M0 | |||
|---|---|---|---|
| Quadrant | BADHDUFLAG | Total packets | Discarded packets |
| A | 0 | 16691 | 0 |
| B | 0 | 18571 | 0 |
| C | 0 | 18554 | 0 |
| D | 0 | 17216 | 0 |
| Mode SS | |||
|---|---|---|---|
| Quadrant | BADHDUFLAG | Total packets | Discarded packets |
| A | 0 | 156 | 0 |
| B | 0 | 156 | 0 |
| C | 0 | 156 | 0 |
| D | 0 | 156 | 0 |
| Mode M9 | |||
|---|---|---|---|
| Quadrant | BADHDUFLAG | Total packets | Discarded packets |
| A | 0 | 22 | 0 |
| B | 0 | 22 | 0 |
| C | 0 | 22 | 0 |
| D | 0 | 22 | 0 |
| Quadrant | Total seconds | Saturated seconds | Saturation percentage |
|---|---|---|---|
| A | 7682 | 91 | 1.184587% |
| B | 7682 | 175 | 2.278053% |
| C | 7682 | 147 | 1.913564% |
| D | 7682 | 93 | 1.210622% |
Noise dominated data is calculated using 1-second bins in cleaned event files. If a bin has >2000 counts, and if more than 50% of those come from <1% of pixels, then it is considered to be noise-dominated and hence unusable.
| Quadrant | # 1 sec bins | Bins with >0 counts | Bins with >2000 counts | High rate bins dominated by noise | Noise dominated (total time) | Noise dominated (detector-on time) | Marked lightcurve |
|---|---|---|---|---|---|---|---|
| A | 9022 | 7682 | 0 | 0 | 0.00% | 0.00% |  |
| B | 9022 | 7682 | 0 | 0 | 0.00% | 0.00% |  |
| C | 9023 | 7683 | 11 | 11 | 0.12% | 0.14% |  |
| D | 9022 | 7682 | 3 | 3 | 0.03% | 0.04% |  |
Top three noisy pixels from each quadrant. If the there are fewer than three noisy pixels in the level2.evt file, extra rows are filled as -1
| Pixel properties | Quadrant properties | ||||||
|---|---|---|---|---|---|---|---|
| Quadrant | DetID | PixID | Counts | Sigma | Mean | Median | Sigma |
| A | 12 | 96 | 31331 | 305.01 | 467 | 460 | 101.2 |
| A | 15 | 223 | 6981 | 64.43 | 467 | 460 | 101.2 |
| A | 3 | 1 | 4667 | 41.57 | 467 | 460 | 101.2 |
| B | 15 | 35 | 280753 | 3136.31 | 474 | 465 | 89.4 |
| B | 0 | 229 | 42684 | 472.41 | 474 | 465 | 89.4 |
| B | 0 | 198 | 41079 | 454.45 | 474 | 465 | 89.4 |
| C | 7 | 247 | 561867 | 5439.31 | 440 | 440 | 103.2 |
| C | 3 | 233 | 115894 | 1118.56 | 440 | 440 | 103.2 |
| C | 13 | 61 | 2661 | 21.52 | 440 | 440 | 103.2 |
| D | 5 | 222 | 146800 | 1402.24 | 451 | 437 | 104.4 |
| D | 1 | 52 | 101815 | 971.26 | 451 | 437 | 104.4 |
| D | 2 | 33 | 66097 | 629.06 | 451 | 437 | 104.4 |
Histogram calculated using DETX and DETY for each event in the final _common_clean file
| Quadrant A |  |
 |
Quadrant B |
|---|---|---|---|
| Quadrant D | 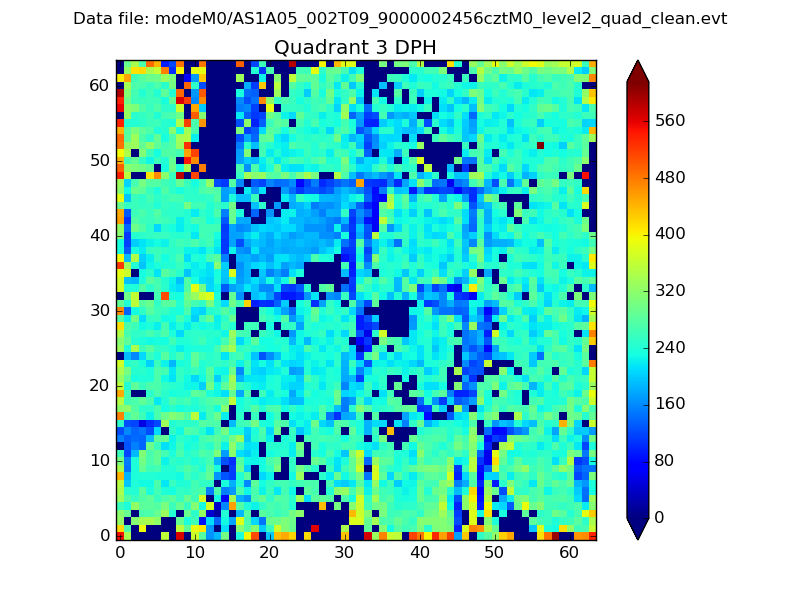 |
 |
Quadrant C |
| Plot type | Count rate plots | Images |
|---|---|---|
| Comparison with Poisson distribution Blue bars denote a histogram of data divided into 1 sec bins. Red curve is a Poisson curve with rate = median count rate of data. |
 |
 |
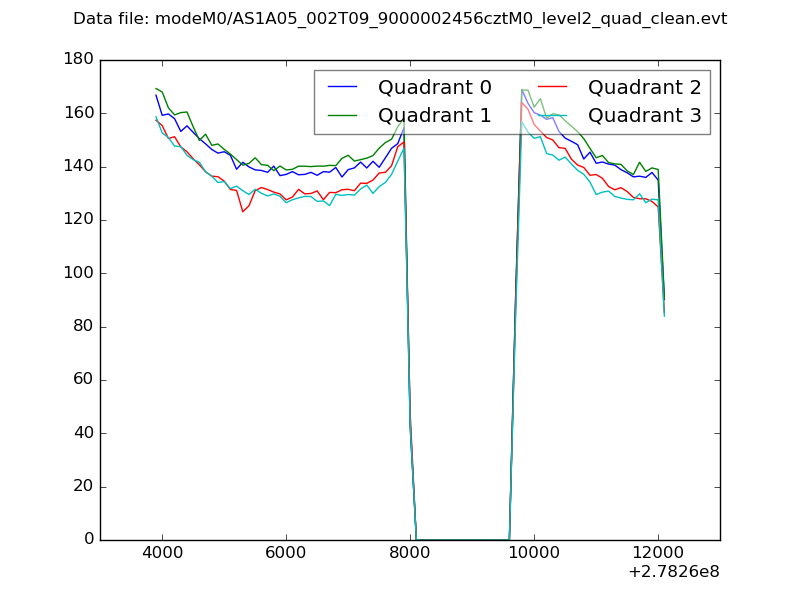
| Quadrant-wise count rates Data is divided into 100 sec bins |
 |
|
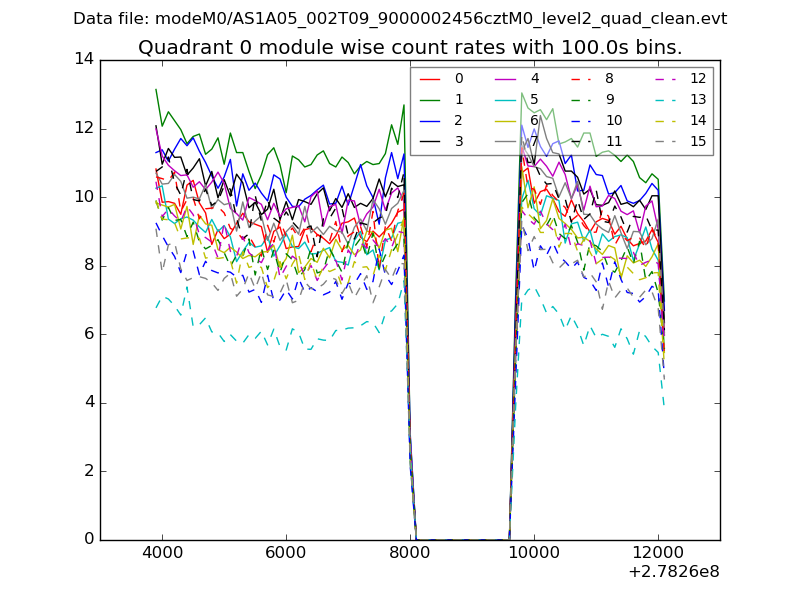
| Module-wise count rates for Quadrant A Data is divided into 100 sec bins |
 |
 |
| Module-wise count rates for Quadrant B Data is divided into 100 sec bins |
 |
 |
| Module-wise count rates for Quadrant C Data is divided into 100 sec bins |
 |
 |
| Module-wise count rates for Quadrant D Data is divided into 100 sec bins |
 |
 |
| Parameter | Plot |
|---|---|
| CZT HV Monitor | 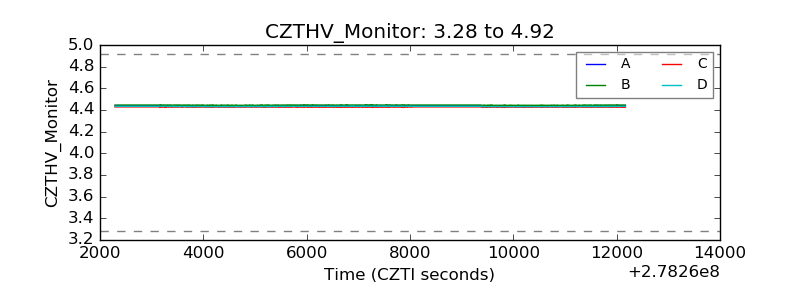 |
| D_VDD | 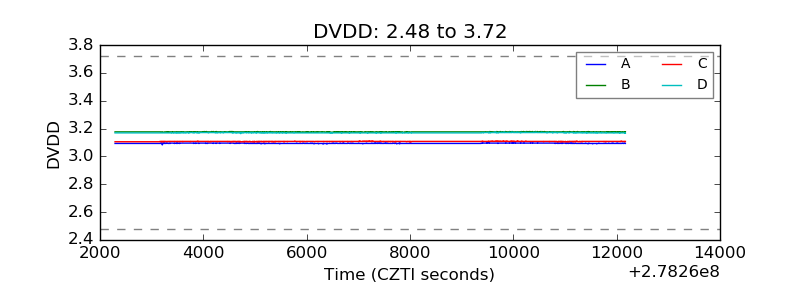 |
| Temperature 1 |  |
| Veto HV Monitor |  |
| Veto LLD |  |
| Alpha Counter |  |
| _CPM_Rate |  |
| CZT Counter |  |
| +2.5 Volts monitor |  |
| +5 Volts monitor |  |
| _ROLL_ROT |  |
| _Roll_DEC |  |
| _Roll_RA |  |
| Veto Counter |  |