| Param | Original file | Final file |
|---|---|---|
| Filename | modeM0/AS1A05_002T07_9000002458cztM0_level2.evt | modeM0/AS1A05_002T07_9000002458cztM0_level2_quad_clean.evt |
| Size (bytes) | 909,455,040 | 212,575,680 |
| Size | 867.3 MB | 202.7 MB |
| Events in quadrant A | 6,552,411 | 1,409,350 |
| Events in quadrant B | 6,958,198 | 1,444,918 |
| Events in quadrant C | 6,427,624 | 1,362,405 |
| Events in quadrant D | 6,723,521 | 1,322,770 |
| Mode M0 | |||
|---|---|---|---|
| Quadrant | BADHDUFLAG | Total packets | Discarded packets |
| A | 0 | 28097 | 0 |
| B | 0 | 29206 | 0 |
| C | 0 | 27607 | 0 |
| D | 0 | 29107 | 0 |
| Mode M9 | |||
|---|---|---|---|
| Quadrant | BADHDUFLAG | Total packets | Discarded packets |
| A | 0 | 33 | 0 |
| B | 0 | 33 | 0 |
| C | 0 | 33 | 0 |
| D | 0 | 33 | 0 |
| Mode SS | |||
|---|---|---|---|
| Quadrant | BADHDUFLAG | Total packets | Discarded packets |
| A | 0 | 268 | 0 |
| B | 0 | 268 | 0 |
| C | 0 | 268 | 0 |
| D | 0 | 268 | 0 |
| Quadrant | Total seconds | Saturated seconds | Saturation percentage |
|---|---|---|---|
| A | 13014 | 152 | 1.167973% |
| B | 13014 | 257 | 1.974796% |
| C | 13014 | 174 | 1.337022% |
| D | 13014 | 152 | 1.167973% |
Noise dominated data is calculated using 1-second bins in cleaned event files. If a bin has >2000 counts, and if more than 50% of those come from <1% of pixels, then it is considered to be noise-dominated and hence unusable.
| Quadrant | # 1 sec bins | Bins with >0 counts | Bins with >2000 counts | High rate bins dominated by noise | Noise dominated (total time) | Noise dominated (detector-on time) | Marked lightcurve |
|---|---|---|---|---|---|---|---|
| A | 16400 | 13018 | 30 | 30 | 0.18% | 0.23% |  |
| B | 16400 | 13018 | 19 | 19 | 0.12% | 0.15% |  |
| C | 16400 | 13018 | 0 | 0 | 0.00% | 0.00% |  |
| D | 16400 | 13018 | 65 | 65 | 0.40% | 0.50% | 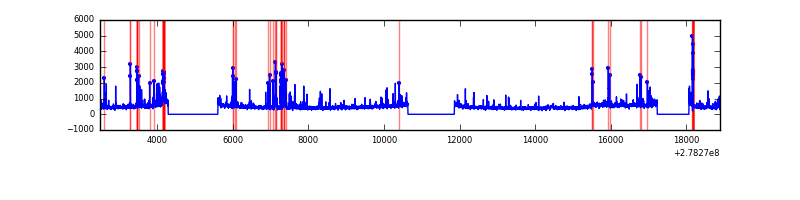 |
Top three noisy pixels from each quadrant. If the there are fewer than three noisy pixels in the level2.evt file, extra rows are filled as -1
| Pixel properties | Quadrant properties | ||||||
|---|---|---|---|---|---|---|---|
| Quadrant | DetID | PixID | Counts | Sigma | Mean | Median | Sigma |
| A | 9 | 143 | 170635 | 539.3 | 1578 | 1544 | 313.5 |
| A | 3 | 1 | 167944 | 530.71 | 1578 | 1544 | 313.5 |
| A | 12 | 96 | 131278 | 413.77 | 1578 | 1544 | 313.5 |
| B | 15 | 35 | 379828 | 1280.54 | 1592 | 1554 | 295.4 |
| B | 0 | 229 | 131712 | 440.61 | 1592 | 1554 | 295.4 |
| B | 0 | 189 | 61144 | 201.72 | 1592 | 1554 | 295.4 |
| C | 3 | 233 | 238583 | 675.08 | 1526 | 1537 | 351.1 |
| C | 14 | 238 | 237494 | 671.98 | 1526 | 1537 | 351.1 |
| C | 13 | 61 | 11032 | 27.04 | 1526 | 1537 | 351.1 |
| D | 1 | 52 | 408039 | 1105.28 | 1531 | 1488 | 367.8 |
| D | 15 | 0 | 233089 | 629.65 | 1531 | 1488 | 367.8 |
| D | 5 | 222 | 181671 | 489.86 | 1531 | 1488 | 367.8 |
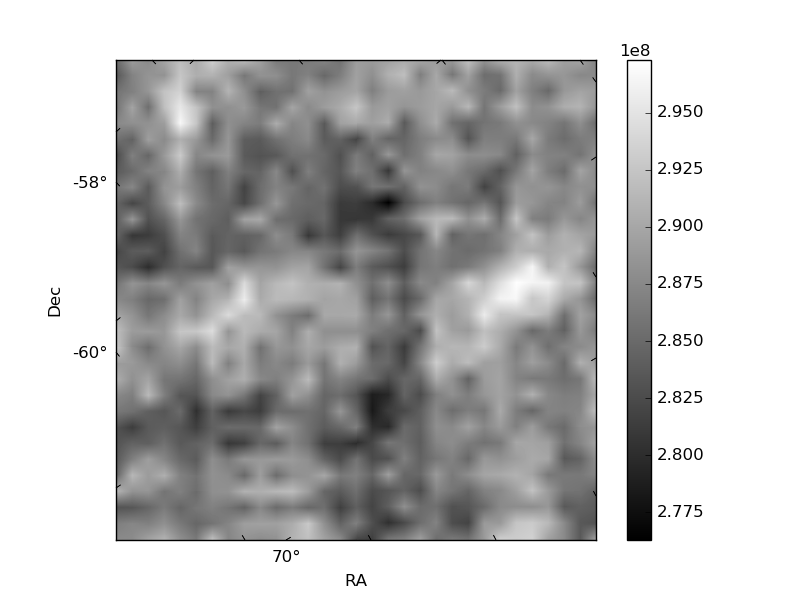
Histogram calculated using DETX and DETY for each event in the final _common_clean file
| Quadrant A |  |
 |
Quadrant B |
|---|---|---|---|
| Quadrant D |  |
 |
Quadrant C |
| Plot type | Count rate plots | Images |
|---|---|---|
| Comparison with Poisson distribution Blue bars denote a histogram of data divided into 1 sec bins. Red curve is a Poisson curve with rate = median count rate of data. |
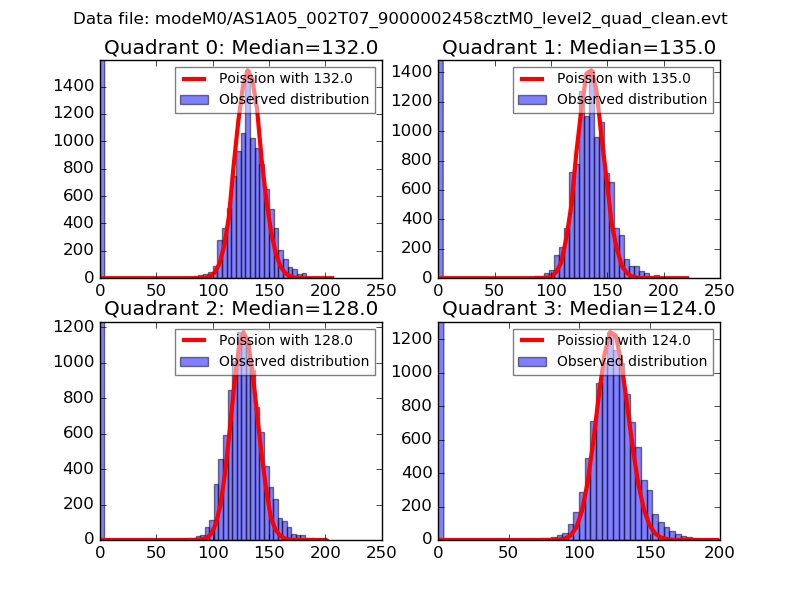 |
 |
| Quadrant-wise count rates Data is divided into 100 sec bins |
 |
|
| Module-wise count rates for Quadrant A Data is divided into 100 sec bins |
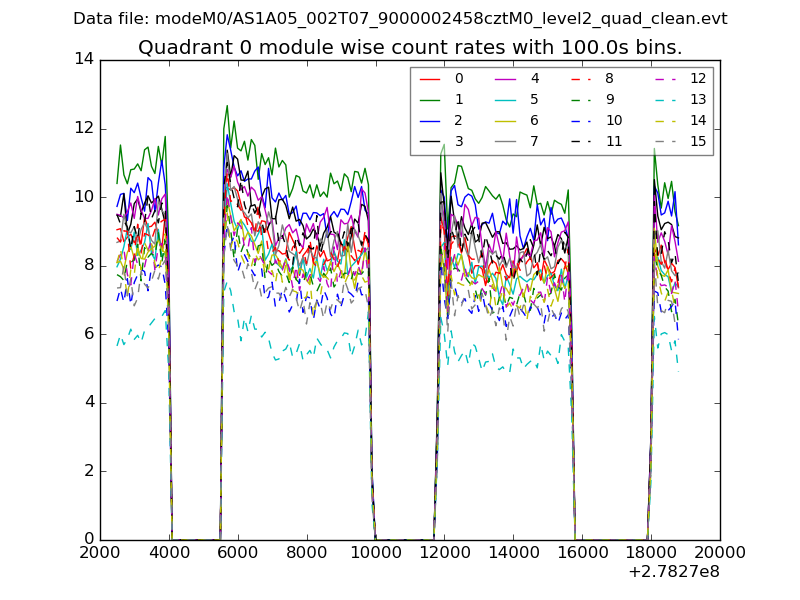 |
 |
| Module-wise count rates for Quadrant B Data is divided into 100 sec bins |
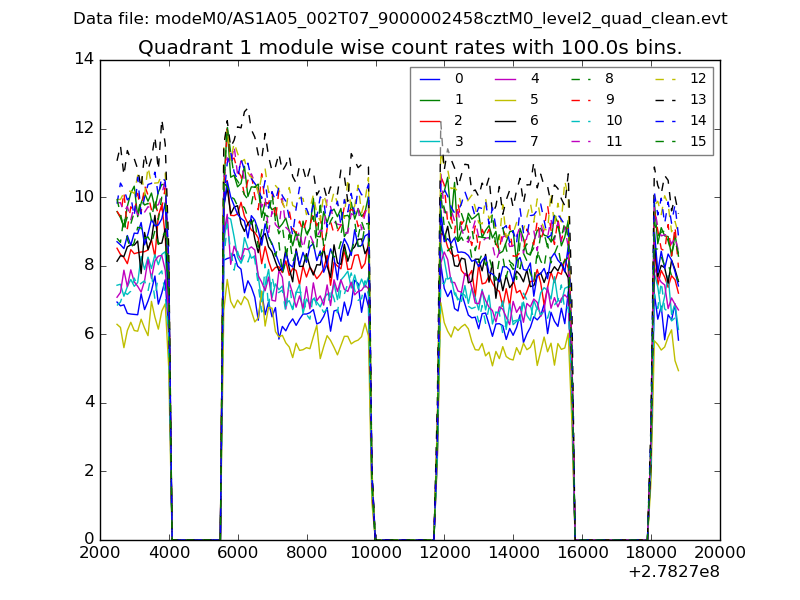 |
 |
| Module-wise count rates for Quadrant C Data is divided into 100 sec bins |
 |
 |
| Module-wise count rates for Quadrant D Data is divided into 100 sec bins |
 |
 |
| Parameter | Plot |
|---|---|
| CZT HV Monitor |  |
| D_VDD |  |
| Temperature 1 | 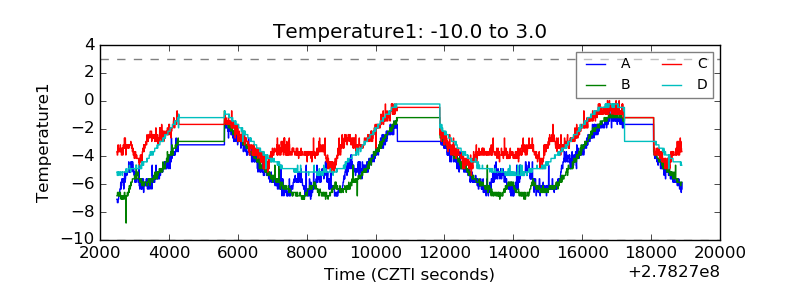 |
| Veto HV Monitor |  |
| Veto LLD |  |
| Alpha Counter |  |
| _CPM_Rate |  |
| CZT Counter |  |
| +2.5 Volts monitor |  |
| +5 Volts monitor |  |
| _ROLL_ROT |  |
| _Roll_DEC |  |
| _Roll_RA |  |
| Veto Counter |  |