| Param | Original file | Final file |
|---|---|---|
| Filename | modeM0/AS1A05_064T01_9000002450cztM0_level2_bc.evt | modeM0/AS1A05_064T01_9000002450cztM0_level2_quad_clean.evt |
| Size (bytes) | 4,290,108,480 | 1,833,935,040 |
| Size | 4.0 GB | 1.7 GB |
| Events in quadrant A | 24,644,297 | 12,431,806 |
| Events in quadrant B | 24,066,354 | 12,629,772 |
| Events in quadrant C | 34,939,821 | 12,142,419 |
| Events in quadrant D | 39,764,944 | 11,787,620 |
| Mode M9 | |||
|---|---|---|---|
| Quadrant | BADHDUFLAG | Total packets | Discarded packets |
| A | 0 | 173 | 0 |
| B | 0 | 173 | 0 |
| C | 0 | 173 | 0 |
| D | 0 | 173 | 0 |
| Mode SS | |||
|---|---|---|---|
| Quadrant | BADHDUFLAG | Total packets | Discarded packets |
| A | 0 | 1954 | 0 |
| B | 0 | 1954 | 0 |
| C | 0 | 1954 | 0 |
| D | 0 | 1954 | 0 |
| Mode M0 | |||
|---|---|---|---|
| Quadrant | BADHDUFLAG | Total packets | Discarded packets |
| A | 0 | 217585 | 0 |
| B | 0 | 214515 | 0 |
| C | 0 | 255352 | 0 |
| D | 0 | 265690 | 0 |
| Quadrant | Total seconds | Saturated seconds | Saturation percentage |
|---|---|---|---|
| A | 95695 | 2927 | 3.058676% |
| B | 95695 | 1558 | 1.628089% |
| C | 95695 | 5095 | 5.324207% |
| D | 95695 | 5433 | 5.677413% |
Noise dominated data is calculated using 1-second bins in cleaned event files. If a bin has >2000 counts, and if more than 50% of those come from <1% of pixels, then it is considered to be noise-dominated and hence unusable.
| Quadrant | # 1 sec bins | Bins with >0 counts | Bins with >2000 counts | High rate bins dominated by noise | Noise dominated (total time) | Noise dominated (detector-on time) | Marked lightcurve |
|---|---|---|---|---|---|---|---|
| A | 113116 | 95699 | 248 | 248 | 0.22% | 0.26% | 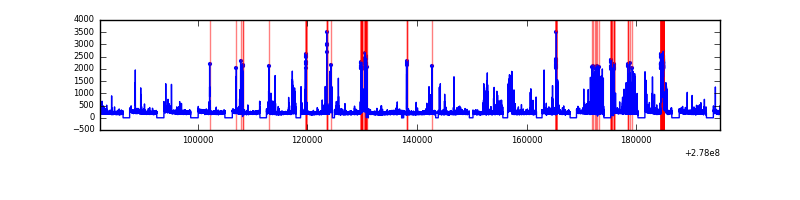 |
| B | 113116 | 95697 | 32 | 32 | 0.03% | 0.03% | 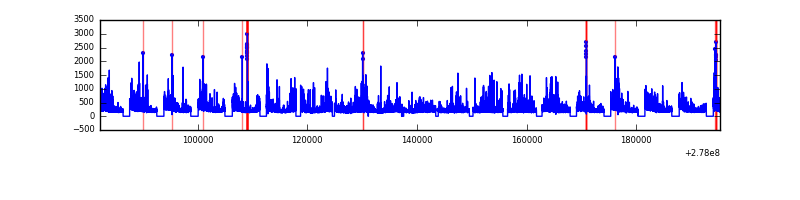 |
| C | 113116 | 95698 | 5 | 5 | 0.00% | 0.01% |  |
| D | 113116 | 95697 | 882 | 882 | 0.78% | 0.92% | 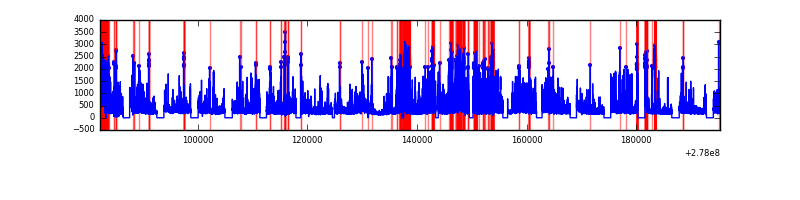 |
Top three noisy pixels from each quadrant. If the there are fewer than three noisy pixels in the level2.evt file, extra rows are filled as -1
| Pixel properties | Quadrant properties | ||||||
|---|---|---|---|---|---|---|---|
| Quadrant | DetID | PixID | Counts | Sigma | Mean | Median | Sigma |
| A | 15 | 174 | 4853426 | 4517.63 | 4999 | 4916 | 1073.2 |
| A | 9 | 143 | 311049 | 285.24 | 4999 | 4916 | 1073.2 |
| A | 13 | 248 | 84216 | 73.89 | 4999 | 4916 | 1073.2 |
| B | 15 | 35 | 1028217 | 1069.88 | 5072 | 4951 | 956.4 |
| B | 0 | 189 | 705624 | 732.59 | 5072 | 4951 | 956.4 |
| B | 0 | 198 | 466278 | 482.34 | 5072 | 4951 | 956.4 |
| C | 3 | 233 | 15256947 | 13337.45 | 4868 | 4849 | 1143.6 |
| C | 7 | 247 | 784197 | 681.51 | 4868 | 4849 | 1143.6 |
| C | 0 | 207 | 146108 | 123.53 | 4868 | 4849 | 1143.6 |
| D | 1 | 52 | 17961654 | 15641.93 | 4924 | 4762 | 1148.0 |
| D | 10 | 70 | 983650 | 852.69 | 4924 | 4762 | 1148.0 |
| D | 5 | 222 | 686561 | 593.9 | 4924 | 4762 | 1148.0 |
Histogram calculated using DETX and DETY for each event in the final _common_clean file
| Quadrant A |  |
 |
Quadrant B |
|---|---|---|---|
| Quadrant D |  |
 |
Quadrant C |
| Plot type | Count rate plots | Images |
|---|---|---|
| Comparison with Poisson distribution Blue bars denote a histogram of data divided into 1 sec bins. Red curve is a Poisson curve with rate = median count rate of data. |
 |
 |
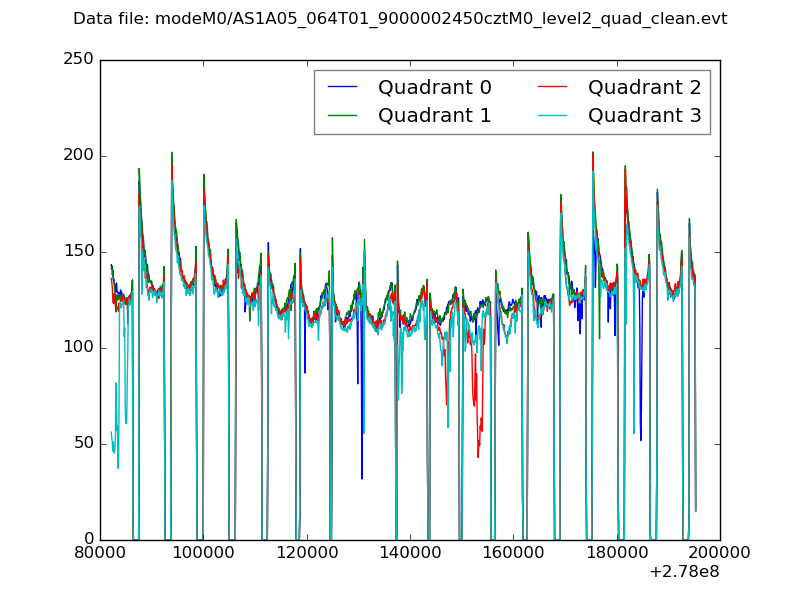
| Quadrant-wise count rates Data is divided into 100 sec bins |
 |
|
| Module-wise count rates for Quadrant A Data is divided into 100 sec bins |
 |
 |
| Module-wise count rates for Quadrant B Data is divided into 100 sec bins |
 |
 |
| Module-wise count rates for Quadrant C Data is divided into 100 sec bins |
 |
 |
| Module-wise count rates for Quadrant D Data is divided into 100 sec bins |
 |
 |
| Parameter | Plot |
|---|---|
| CZT HV Monitor |  |
| D_VDD |  |
| Temperature 1 |  |
| Veto HV Monitor |  |
| Veto LLD |  |
| Alpha Counter |  |
| _CPM_Rate |  |
| CZT Counter |  |
| +2.5 Volts monitor |  |
| +5 Volts monitor |  |
| _ROLL_ROT |  |
| _Roll_DEC |  |
| _Roll_RA |  |
| Veto Counter | 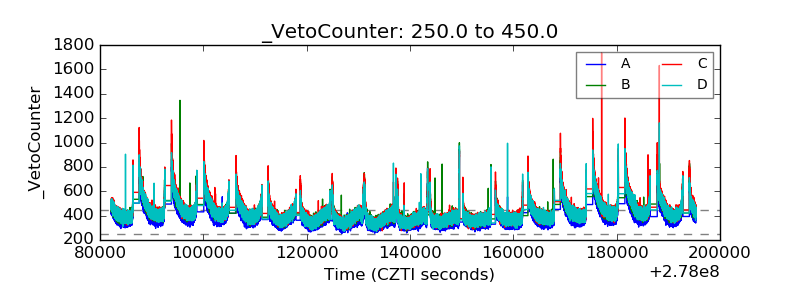 |