| Param | Original file | Final file |
|---|---|---|
| Filename | modeM0/AS1C04_009T01_9000002448cztM0_level2_bc.evt | modeM0/AS1C04_009T01_9000002448cztM0_level2_quad_clean.evt |
| Size (bytes) | 3,232,497,600 | 1,683,694,080 |
| Size | 3.0 GB | 1.6 GB |
| Events in quadrant A | 19,491,117 | 11,281,631 |
| Events in quadrant B | 24,033,242 | 11,522,940 |
| Events in quadrant C | 22,127,993 | 11,222,264 |
| Events in quadrant D | 26,127,619 | 10,821,894 |
| Mode M9 | |||
|---|---|---|---|
| Quadrant | BADHDUFLAG | Total packets | Discarded packets |
| A | 0 | 151 | 0 |
| B | 0 | 151 | 0 |
| C | 0 | 151 | 0 |
| D | 0 | 151 | 0 |
| Mode M0 | |||
|---|---|---|---|
| Quadrant | BADHDUFLAG | Total packets | Discarded packets |
| A | 0 | 190031 | 0 |
| B | 0 | 204728 | 0 |
| C | 0 | 198792 | 0 |
| D | 0 | 211401 | 0 |
| Mode SS | |||
|---|---|---|---|
| Quadrant | BADHDUFLAG | Total packets | Discarded packets |
| A | 0 | 1828 | 0 |
| B | 0 | 1828 | 0 |
| C | 0 | 1828 | 0 |
| D | 0 | 1828 | 0 |
| Quadrant | Total seconds | Saturated seconds | Saturation percentage |
|---|---|---|---|
| A | 89803 | 1087 | 1.210427% |
| B | 89803 | 1282 | 1.427569% |
| C | 89803 | 1127 | 1.254969% |
| D | 89803 | 2672 | 2.975402% |
Noise dominated data is calculated using 1-second bins in cleaned event files. If a bin has >2000 counts, and if more than 50% of those come from <1% of pixels, then it is considered to be noise-dominated and hence unusable.
| Quadrant | # 1 sec bins | Bins with >0 counts | Bins with >2000 counts | High rate bins dominated by noise | Noise dominated (total time) | Noise dominated (detector-on time) | Marked lightcurve |
|---|---|---|---|---|---|---|---|
| A | 104784 | 89805 | 40 | 40 | 0.04% | 0.04% | 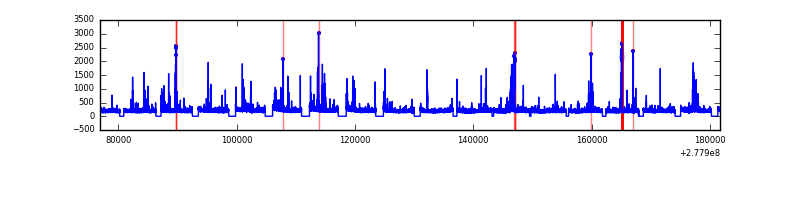 |
| B | 104784 | 89805 | 26 | 26 | 0.02% | 0.03% |  |
| C | 104784 | 89807 | 0 | 0 | 0.00% | 0.00% |  |
| D | 104784 | 89805 | 442 | 442 | 0.42% | 0.49% | 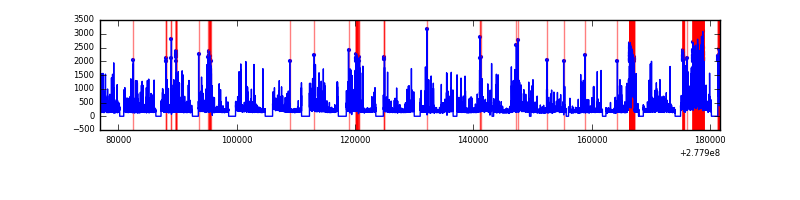 |
Top three noisy pixels from each quadrant. If the there are fewer than three noisy pixels in the level2.evt file, extra rows are filled as -1
| Pixel properties | Quadrant properties | ||||||
|---|---|---|---|---|---|---|---|
| Quadrant | DetID | PixID | Counts | Sigma | Mean | Median | Sigma |
| A | 15 | 174 | 1295384 | 1304.04 | 4536 | 4450 | 989.9 |
| A | 9 | 143 | 331283 | 330.15 | 4536 | 4450 | 989.9 |
| A | 15 | 69 | 327174 | 326.0 | 4536 | 4450 | 989.9 |
| B | 15 | 35 | 1444918 | 1645.13 | 4624 | 4509 | 875.6 |
| B | 0 | 85 | 870751 | 989.36 | 4624 | 4509 | 875.6 |
| B | 0 | 189 | 699810 | 794.12 | 4624 | 4509 | 875.6 |
| C | 3 | 233 | 3539318 | 3349.01 | 4473 | 4458 | 1055.5 |
| C | 7 | 247 | 1226690 | 1157.97 | 4473 | 4458 | 1055.5 |
| C | 3 | 232 | 110826 | 100.78 | 4473 | 4458 | 1055.5 |
| D | 1 | 52 | 4723792 | 4488.54 | 4489 | 4328 | 1051.4 |
| D | 2 | 16 | 1843469 | 1749.15 | 4489 | 4328 | 1051.4 |
| D | 10 | 70 | 795798 | 752.74 | 4489 | 4328 | 1051.4 |
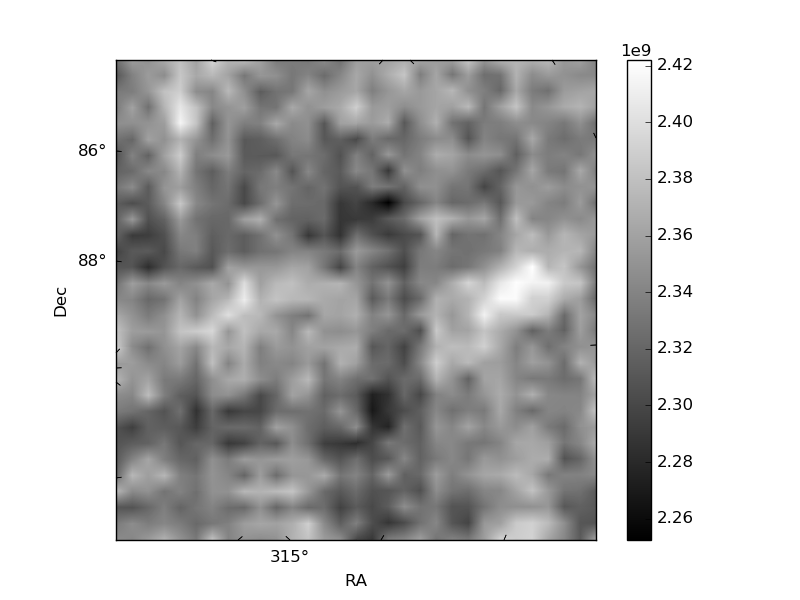
Histogram calculated using DETX and DETY for each event in the final _common_clean file
| Quadrant A |  |
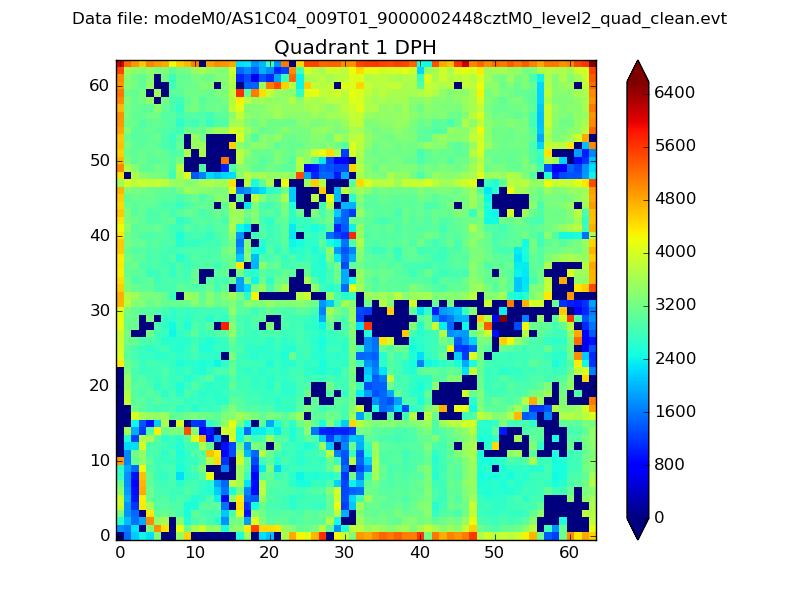 |
Quadrant B |
|---|---|---|---|
| Quadrant D |  |
 |
Quadrant C |
| Plot type | Count rate plots | Images |
|---|---|---|
| Comparison with Poisson distribution Blue bars denote a histogram of data divided into 1 sec bins. Red curve is a Poisson curve with rate = median count rate of data. |
 |
 |
| Quadrant-wise count rates Data is divided into 100 sec bins |
 |
|
| Module-wise count rates for Quadrant A Data is divided into 100 sec bins |
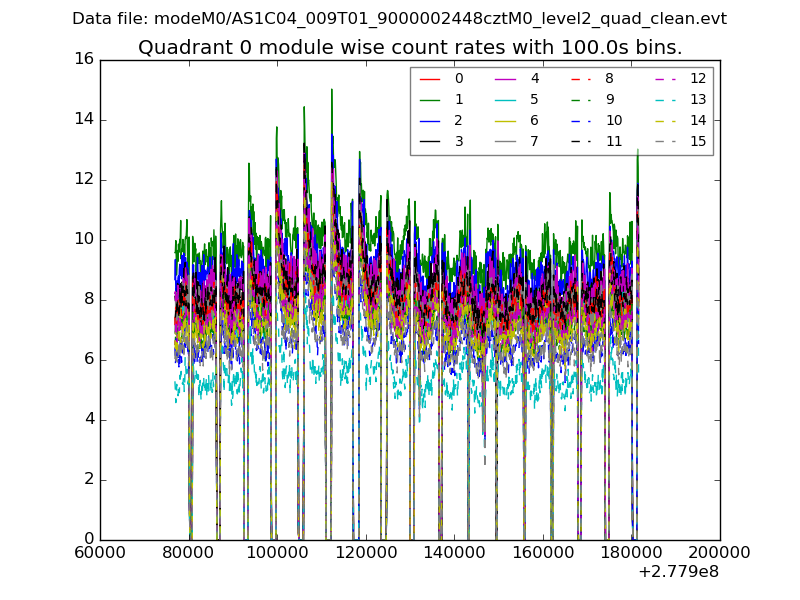 |
 |
| Module-wise count rates for Quadrant B Data is divided into 100 sec bins |
 |
 |
| Module-wise count rates for Quadrant C Data is divided into 100 sec bins |
 |
 |
| Module-wise count rates for Quadrant D Data is divided into 100 sec bins |
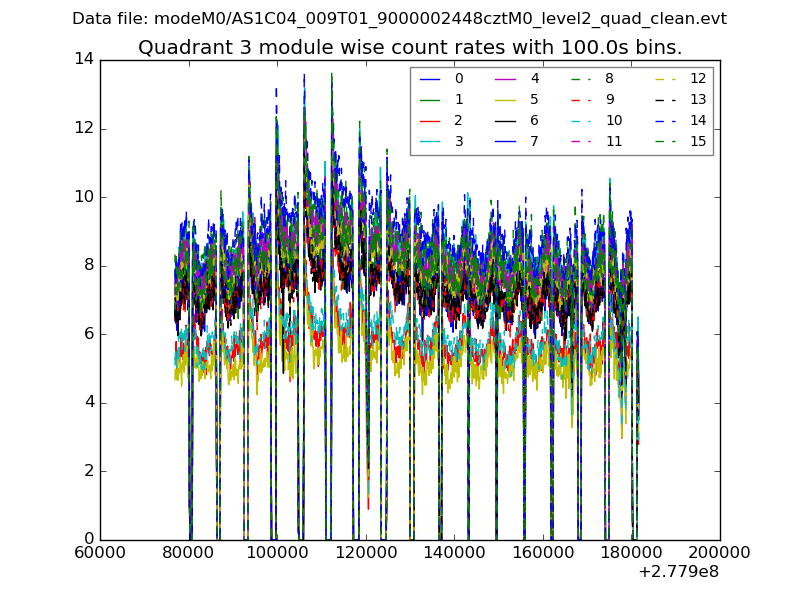 |
 |
| Parameter | Plot |
|---|---|
| CZT HV Monitor | 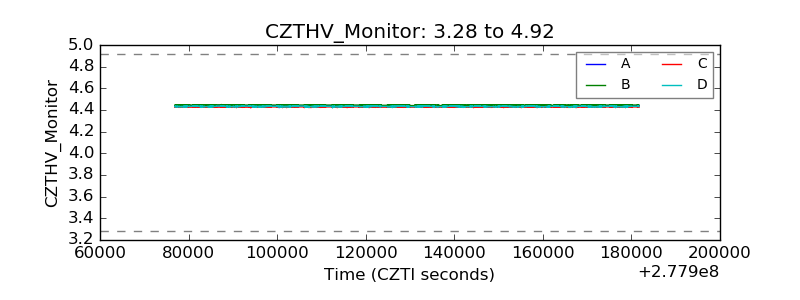 |
| D_VDD |  |
| Temperature 1 |  |
| Veto HV Monitor |  |
| Veto LLD | 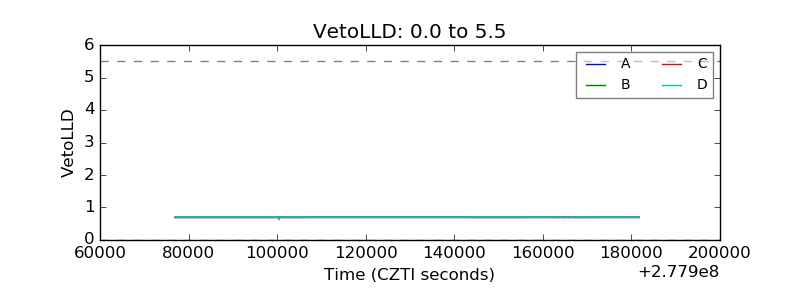 |
| Alpha Counter |  |
| _CPM_Rate |  |
| CZT Counter |  |
| +2.5 Volts monitor |  |
| +5 Volts monitor |  |
| _ROLL_ROT |  |
| _Roll_DEC |  |
| _Roll_RA | 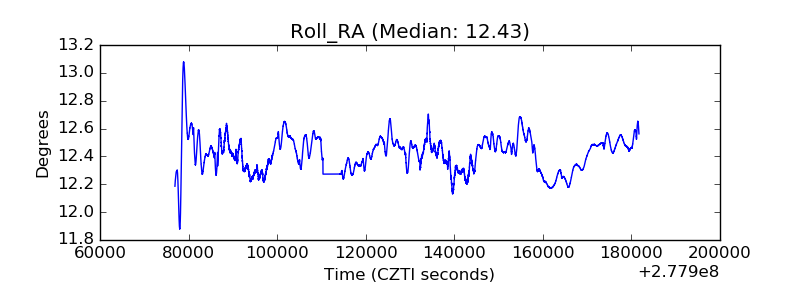 |
| Veto Counter |  |