| Param | Original file | Final file |
|---|---|---|
| Filename | modeM0/AS1C04_001T01_9000002446cztM0_level2_bc.evt | modeM0/AS1C04_001T01_9000002446cztM0_level2_quad_clean.evt |
| Size (bytes) | 1,885,968,000 | 988,470,720 |
| Size | 1.8 GB | 942.7 MB |
| Events in quadrant A | 12,211,010 | 6,719,168 |
| Events in quadrant B | 13,686,194 | 6,766,301 |
| Events in quadrant C | 13,994,140 | 6,581,057 |
| Events in quadrant D | 13,663,543 | 6,292,883 |
| Mode M0 | |||
|---|---|---|---|
| Quadrant | BADHDUFLAG | Total packets | Discarded packets |
| A | 0 | 113631 | 0 |
| B | 0 | 118386 | 0 |
| C | 0 | 120881 | 0 |
| D | 0 | 121105 | 0 |
| Mode M9 | |||
|---|---|---|---|
| Quadrant | BADHDUFLAG | Total packets | Discarded packets |
| A | 0 | 84 | 0 |
| B | 0 | 84 | 0 |
| C | 0 | 84 | 0 |
| D | 0 | 84 | 0 |
| Mode SS | |||
|---|---|---|---|
| Quadrant | BADHDUFLAG | Total packets | Discarded packets |
| A | 0 | 1060 | 0 |
| B | 0 | 1060 | 0 |
| C | 0 | 1060 | 0 |
| D | 0 | 1060 | 0 |
| Quadrant | Total seconds | Saturated seconds | Saturation percentage |
|---|---|---|---|
| A | 52231 | 831 | 1.591009% |
| B | 52231 | 917 | 1.755662% |
| C | 52231 | 858 | 1.642703% |
| D | 52231 | 2191 | 4.194827% |
Noise dominated data is calculated using 1-second bins in cleaned event files. If a bin has >2000 counts, and if more than 50% of those come from <1% of pixels, then it is considered to be noise-dominated and hence unusable.
| Quadrant | # 1 sec bins | Bins with >0 counts | Bins with >2000 counts | High rate bins dominated by noise | Noise dominated (total time) | Noise dominated (detector-on time) | Marked lightcurve |
|---|---|---|---|---|---|---|---|
| A | 60584 | 52233 | 12 | 12 | 0.02% | 0.02% |  |
| B | 60584 | 52234 | 8 | 8 | 0.01% | 0.02% |  |
| C | 60584 | 52233 | 1 | 1 | 0.00% | 0.00% |  |
| D | 60584 | 52199 | 78 | 78 | 0.13% | 0.15% |  |
Top three noisy pixels from each quadrant. If the there are fewer than three noisy pixels in the level2.evt file, extra rows are filled as -1
| Pixel properties | Quadrant properties | ||||||
|---|---|---|---|---|---|---|---|
| Quadrant | DetID | PixID | Counts | Sigma | Mean | Median | Sigma |
| A | 15 | 174 | 1646679 | 2834.91 | 2695 | 2652 | 579.9 |
| A | 9 | 143 | 131617 | 222.38 | 2695 | 2652 | 579.9 |
| A | 15 | 223 | 61328 | 101.18 | 2695 | 2652 | 579.9 |
| B | 15 | 35 | 766978 | 1515.25 | 2715 | 2654 | 504.4 |
| B | 0 | 85 | 604550 | 1193.24 | 2715 | 2654 | 504.4 |
| B | 0 | 229 | 486296 | 958.8 | 2715 | 2654 | 504.4 |
| C | 3 | 233 | 3747558 | 6027.22 | 2624 | 2607 | 621.3 |
| C | 7 | 247 | 103566 | 162.49 | 2624 | 2607 | 621.3 |
| C | 8 | 128 | 33372 | 49.51 | 2624 | 2607 | 621.3 |
| D | 1 | 52 | 1500915 | 2470.84 | 2603 | 2515 | 606.4 |
| D | 5 | 222 | 1100838 | 1811.12 | 2603 | 2515 | 606.4 |
| D | 10 | 70 | 479400 | 786.38 | 2603 | 2515 | 606.4 |
Histogram calculated using DETX and DETY for each event in the final _common_clean file
| Quadrant A |  |
 |
Quadrant B |
|---|---|---|---|
| Quadrant D |  |
 |
Quadrant C |
| Plot type | Count rate plots | Images |
|---|---|---|
| Comparison with Poisson distribution Blue bars denote a histogram of data divided into 1 sec bins. Red curve is a Poisson curve with rate = median count rate of data. |
 |
 |
| Quadrant-wise count rates Data is divided into 100 sec bins |
 |
|
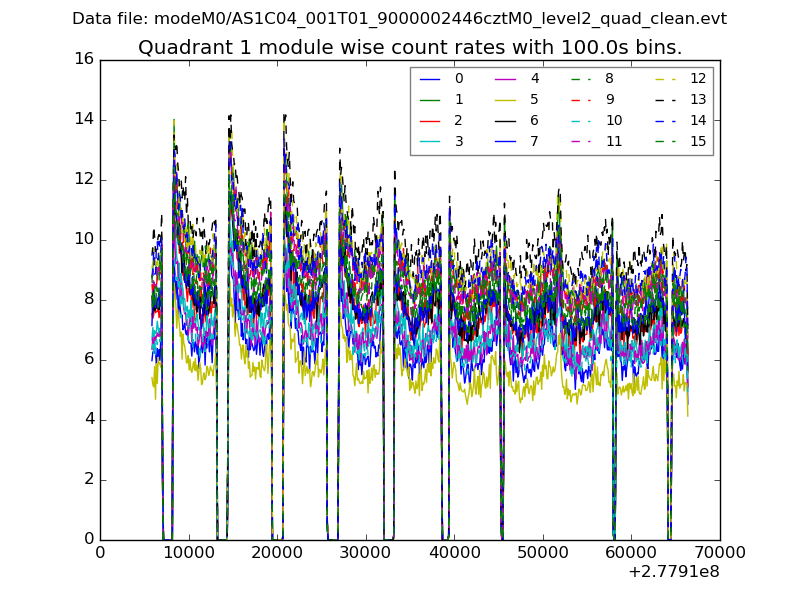
| Module-wise count rates for Quadrant A Data is divided into 100 sec bins |
 |
 |
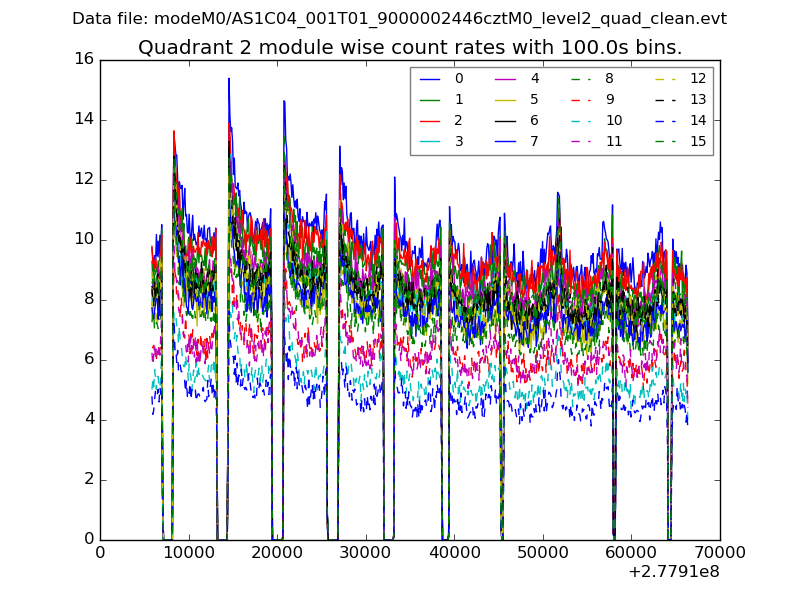
| Module-wise count rates for Quadrant B Data is divided into 100 sec bins |
 |
 |
| Module-wise count rates for Quadrant C Data is divided into 100 sec bins |
 |
 |
| Module-wise count rates for Quadrant D Data is divided into 100 sec bins |
 |
 |
| Parameter | Plot |
|---|---|
| CZT HV Monitor |  |
| D_VDD |  |
| Temperature 1 |  |
| Veto HV Monitor |  |
| Veto LLD |  |
| Alpha Counter |  |
| _CPM_Rate |  |
| CZT Counter |  |
| +2.5 Volts monitor |  |
| +5 Volts monitor |  |
| _ROLL_ROT |  |
| _Roll_DEC |  |
| _Roll_RA |  |
| Veto Counter |  |