| Param | Original file | Final file |
|---|---|---|
| Filename | modeM0/AS1T03_018T01_9000002442cztM0_level2_bc.evt | modeM0/AS1T03_018T01_9000002442cztM0_level2_quad_clean.evt |
| Size (bytes) | 8,816,063,040 | 2,717,809,920 |
| Size | 8.2 GB | 2.5 GB |
| Events in quadrant A | 54,379,555 | 16,915,888 |
| Events in quadrant B | 59,957,444 | 17,354,026 |
| Events in quadrant C | 74,814,581 | 16,737,912 |
| Events in quadrant D | 62,560,012 | 15,929,376 |
| Mode SS | |||
|---|---|---|---|
| Quadrant | BADHDUFLAG | Total packets | Discarded packets |
| A | 0 | 4582 | 0 |
| B | 0 | 4582 | 0 |
| C | 0 | 4582 | 0 |
| D | 0 | 4582 | 0 |
| Mode M0 | |||
|---|---|---|---|
| Quadrant | BADHDUFLAG | Total packets | Discarded packets |
| A | 0 | 499563 | 0 |
| B | 0 | 515623 | 0 |
| C | 0 | 575712 | 0 |
| D | 0 | 541544 | 0 |
| Mode M9 | |||
|---|---|---|---|
| Quadrant | BADHDUFLAG | Total packets | Discarded packets |
| A | 0 | 366 | 0 |
| B | 0 | 366 | 0 |
| C | 0 | 366 | 0 |
| D | 0 | 366 | 0 |
| Quadrant | Total seconds | Saturated seconds | Saturation percentage |
|---|---|---|---|
| A | 224524 | 5641 | 2.512426% |
| B | 224524 | 4834 | 2.152999% |
| C | 224524 | 10274 | 4.575903% |
| D | 224524 | 11777 | 5.245319% |
Noise dominated data is calculated using 1-second bins in cleaned event files. If a bin has >2000 counts, and if more than 50% of those come from <1% of pixels, then it is considered to be noise-dominated and hence unusable.
| Quadrant | # 1 sec bins | Bins with >0 counts | Bins with >2000 counts | High rate bins dominated by noise | Noise dominated (total time) | Noise dominated (detector-on time) | Marked lightcurve |
|---|---|---|---|---|---|---|---|
| A | 261370 | 224518 | 153 | 153 | 0.06% | 0.07% |  |
| B | 261370 | 224507 | 424 | 424 | 0.16% | 0.19% | 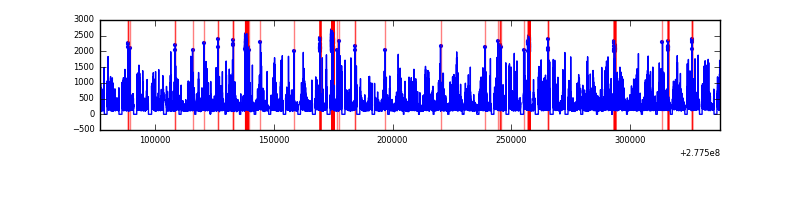 |
| C | 261370 | 224512 | 323 | 323 | 0.12% | 0.14% |  |
| D | 261369 | 224471 | 319 | 319 | 0.12% | 0.14% | 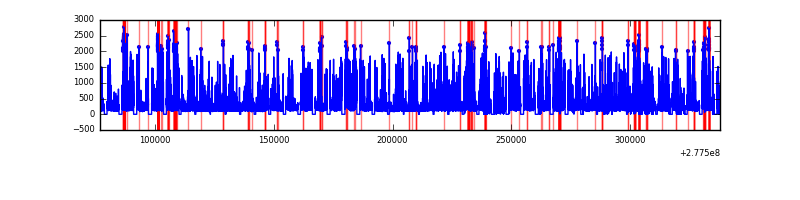 |
Top three noisy pixels from each quadrant. If the there are fewer than three noisy pixels in the level2.evt file, extra rows are filled as -1
| Pixel properties | Quadrant properties | ||||||
|---|---|---|---|---|---|---|---|
| Quadrant | DetID | PixID | Counts | Sigma | Mean | Median | Sigma |
| A | 15 | 174 | 8806041 | 3530.51 | 11490 | 11260 | 2491.1 |
| A | 3 | 1 | 516514 | 202.83 | 11490 | 11260 | 2491.1 |
| A | 15 | 223 | 380423 | 148.19 | 11490 | 11260 | 2491.1 |
| B | 15 | 35 | 3664859 | 1652.0 | 11769 | 11448 | 2211.5 |
| B | 7 | 220 | 1494918 | 670.8 | 11769 | 11448 | 2211.5 |
| B | 0 | 229 | 1463037 | 656.38 | 11769 | 11448 | 2211.5 |
| C | 3 | 233 | 30440731 | 11786.37 | 11159 | 11118 | 2581.8 |
| C | 7 | 247 | 1357047 | 521.32 | 11159 | 11118 | 2581.8 |
| C | 13 | 61 | 66937 | 21.62 | 11159 | 11118 | 2581.8 |
| D | 1 | 52 | 8787722 | 3445.92 | 11116 | 10708 | 2547.1 |
| D | 5 | 222 | 3835603 | 1501.68 | 11116 | 10708 | 2547.1 |
| D | 10 | 70 | 2005722 | 783.26 | 11116 | 10708 | 2547.1 |
Histogram calculated using DETX and DETY for each event in the final _common_clean file
| Quadrant A | 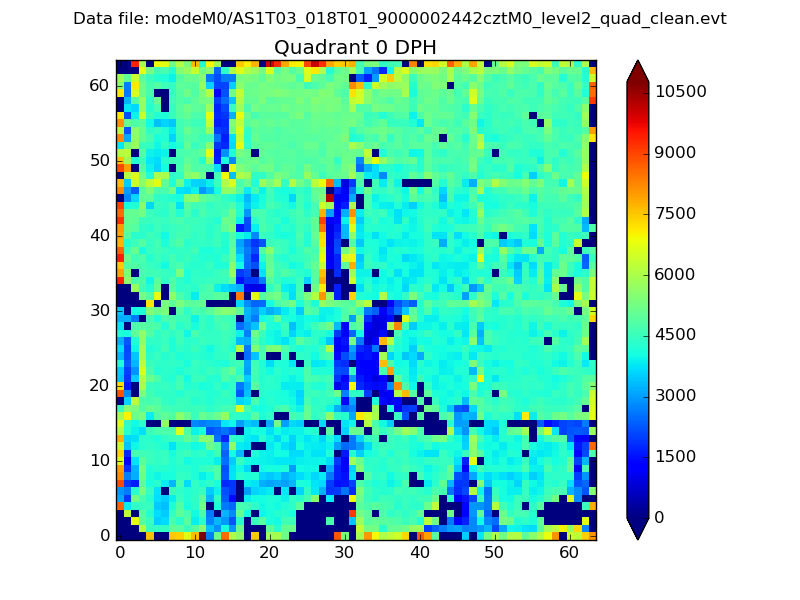 |
 |
Quadrant B |
|---|---|---|---|
| Quadrant D |  |
 |
Quadrant C |
| Plot type | Count rate plots | Images |
|---|---|---|
| Comparison with Poisson distribution Blue bars denote a histogram of data divided into 1 sec bins. Red curve is a Poisson curve with rate = median count rate of data. |
 |
 |
| Quadrant-wise count rates Data is divided into 100 sec bins |
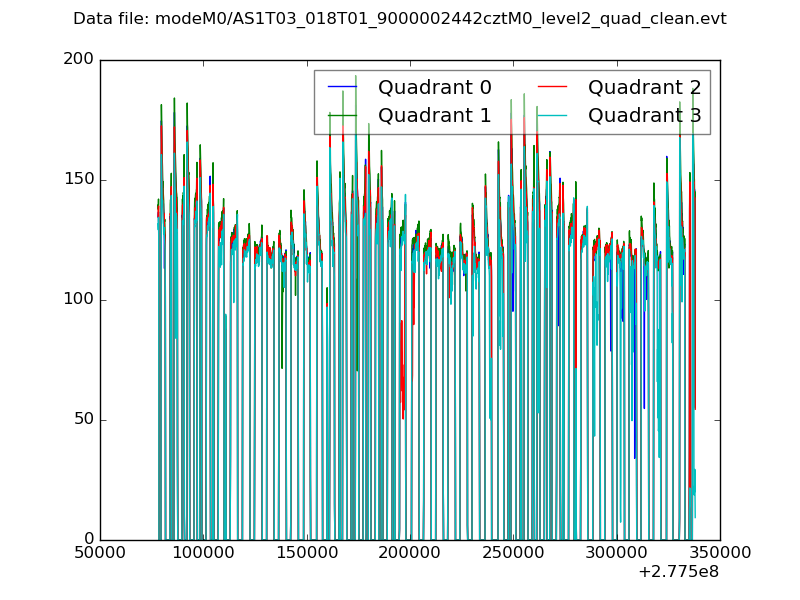 |
|
| Module-wise count rates for Quadrant A Data is divided into 100 sec bins |
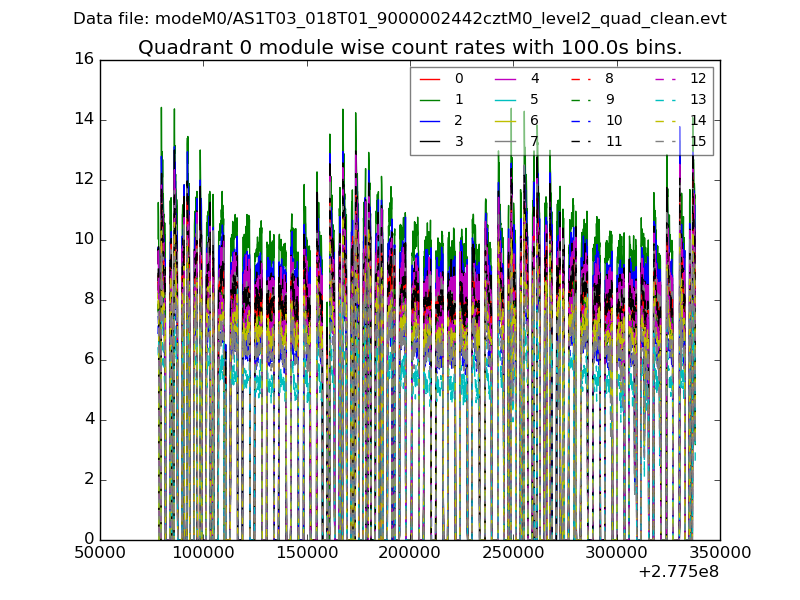 |
 |
| Module-wise count rates for Quadrant B Data is divided into 100 sec bins |
 |
 |
| Module-wise count rates for Quadrant C Data is divided into 100 sec bins |
 |
 |
| Module-wise count rates for Quadrant D Data is divided into 100 sec bins |
 |
 |
| Parameter | Plot |
|---|---|
| CZT HV Monitor |  |
| D_VDD |  |
| Temperature 1 |  |
| Veto HV Monitor |  |
| Veto LLD |  |
| Alpha Counter |  |
| _CPM_Rate |  |
| CZT Counter |  |
| +2.5 Volts monitor |  |
| +5 Volts monitor | 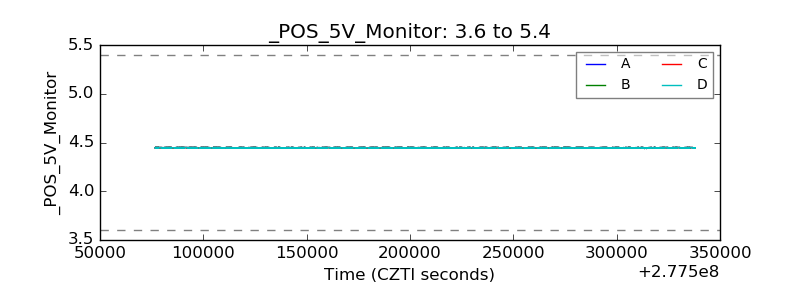 |
| _ROLL_ROT |  |
| _Roll_DEC |  |
| _Roll_RA |  |
| Veto Counter |  |