| Param | Original file | Final file |
|---|---|---|
| Filename | modeM0/AS1A05_108T01_9000002438cztM0_level2_bc.evt | modeM0/AS1A05_108T01_9000002438cztM0_level2_quad_clean.evt |
| Size (bytes) | 2,607,727,680 | 918,872,640 |
| Size | 2.4 GB | 876.3 MB |
| Events in quadrant A | 20,308,498 | 5,637,904 |
| Events in quadrant B | 18,400,734 | 5,899,425 |
| Events in quadrant C | 18,650,073 | 5,642,790 |
| Events in quadrant D | 16,527,652 | 5,533,630 |
| Mode SS | |||
|---|---|---|---|
| Quadrant | BADHDUFLAG | Total packets | Discarded packets |
| A | 0 | 1520 | 0 |
| B | 0 | 1520 | 0 |
| C | 0 | 1520 | 0 |
| D | 0 | 1520 | 0 |
| Mode M0 | |||
|---|---|---|---|
| Quadrant | BADHDUFLAG | Total packets | Discarded packets |
| A | 0 | 177086 | 0 |
| B | 0 | 165163 | 0 |
| C | 0 | 166820 | 0 |
| D | 0 | 158263 | 0 |
| Mode M9 | |||
|---|---|---|---|
| Quadrant | BADHDUFLAG | Total packets | Discarded packets |
| A | 0 | 116 | 0 |
| B | 0 | 116 | 0 |
| C | 0 | 116 | 0 |
| D | 0 | 116 | 0 |
| Quadrant | Total seconds | Saturated seconds | Saturation percentage |
|---|---|---|---|
| A | 74642 | 3344 | 4.480051% |
| B | 74642 | 1287 | 1.724230% |
| C | 74643 | 1473 | 1.973393% |
| D | 74641 | 859 | 1.150842% |
Noise dominated data is calculated using 1-second bins in cleaned event files. If a bin has >2000 counts, and if more than 50% of those come from <1% of pixels, then it is considered to be noise-dominated and hence unusable.
| Quadrant | # 1 sec bins | Bins with >0 counts | Bins with >2000 counts | High rate bins dominated by noise | Noise dominated (total time) | Noise dominated (detector-on time) | Marked lightcurve |
|---|---|---|---|---|---|---|---|
| A | 86195 | 74637 | 169 | 169 | 0.20% | 0.23% | 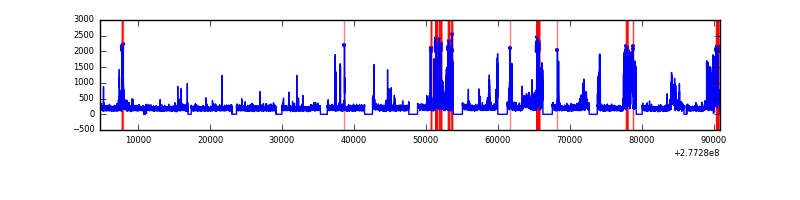 |
| B | 86195 | 74635 | 16 | 16 | 0.02% | 0.02% |  |
| C | 86195 | 74637 | 0 | 0 | 0.00% | 0.00% |  |
| D | 86195 | 74639 | 88 | 88 | 0.10% | 0.12% | 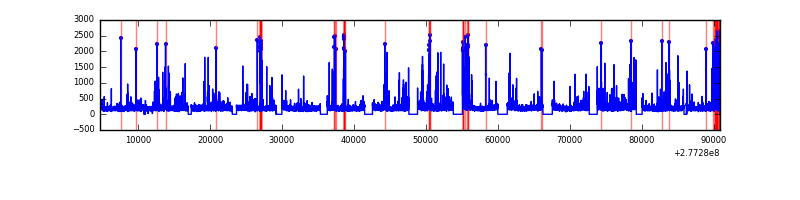 |
Top three noisy pixels from each quadrant. If the there are fewer than three noisy pixels in the level2.evt file, extra rows are filled as -1
| Pixel properties | Quadrant properties | ||||||
|---|---|---|---|---|---|---|---|
| Quadrant | DetID | PixID | Counts | Sigma | Mean | Median | Sigma |
| A | 15 | 174 | 6007451 | 7400.35 | 3718 | 3643 | 811.3 |
| A | 15 | 223 | 33986 | 37.4 | 3718 | 3643 | 811.3 |
| A | 0 | 226 | 24400 | 25.59 | 3718 | 3643 | 811.3 |
| B | 4 | 48 | 684814 | 936.21 | 3853 | 3751 | 727.5 |
| B | 5 | 65 | 594806 | 812.48 | 3853 | 3751 | 727.5 |
| B | 15 | 35 | 462394 | 630.46 | 3853 | 3751 | 727.5 |
| C | 3 | 233 | 3537643 | 4100.34 | 3675 | 3642 | 861.9 |
| C | 7 | 247 | 967475 | 1118.29 | 3675 | 3642 | 861.9 |
| C | 13 | 61 | 21516 | 20.74 | 3675 | 3642 | 861.9 |
| D | 13 | 248 | 556341 | 637.44 | 3739 | 3599 | 867.1 |
| D | 10 | 70 | 309818 | 353.14 | 3739 | 3599 | 867.1 |
| D | 2 | 234 | 298741 | 340.37 | 3739 | 3599 | 867.1 |
Histogram calculated using DETX and DETY for each event in the final _common_clean file
| Quadrant A | 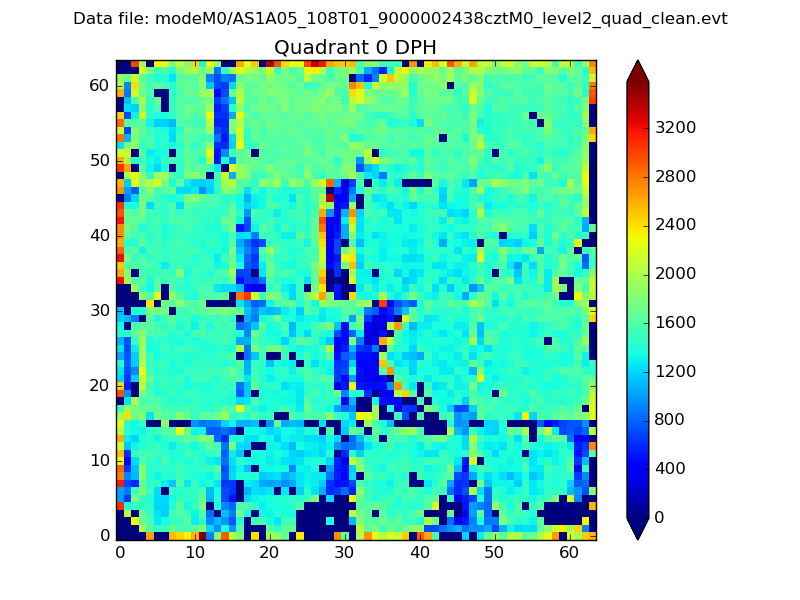 |
 |
Quadrant B |
|---|---|---|---|
| Quadrant D |  |
 |
Quadrant C |
| Plot type | Count rate plots | Images |
|---|---|---|
| Comparison with Poisson distribution Blue bars denote a histogram of data divided into 1 sec bins. Red curve is a Poisson curve with rate = median count rate of data. |
 |
 |
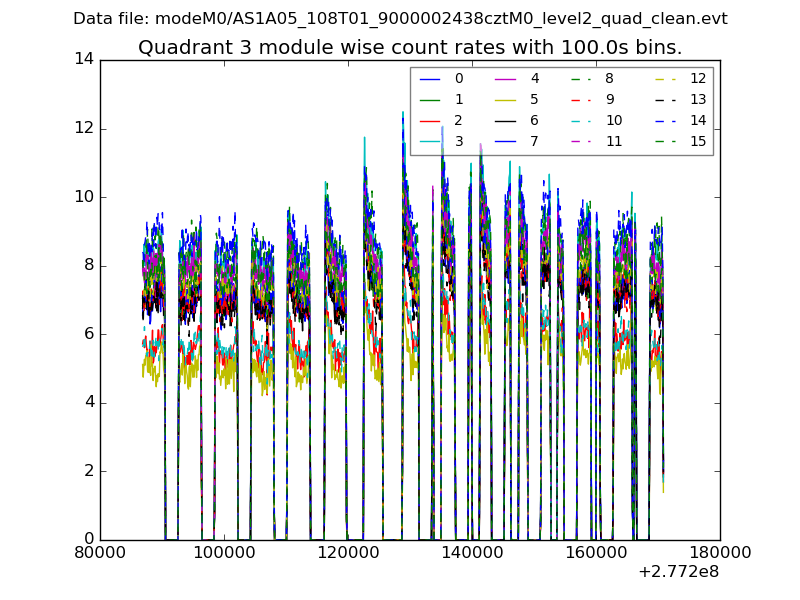
| Quadrant-wise count rates Data is divided into 100 sec bins |
 |
|
| Module-wise count rates for Quadrant A Data is divided into 100 sec bins |
 |
 |
| Module-wise count rates for Quadrant B Data is divided into 100 sec bins |
 |
 |
| Module-wise count rates for Quadrant C Data is divided into 100 sec bins |
 |
 |
| Module-wise count rates for Quadrant D Data is divided into 100 sec bins |
 |
 |
| Parameter | Plot |
|---|---|
| CZT HV Monitor | 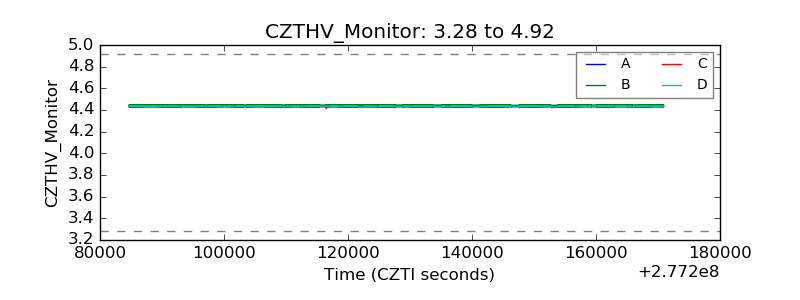 |
| D_VDD |  |
| Temperature 1 |  |
| Veto HV Monitor |  |
| Veto LLD |  |
| Alpha Counter |  |
| _CPM_Rate | 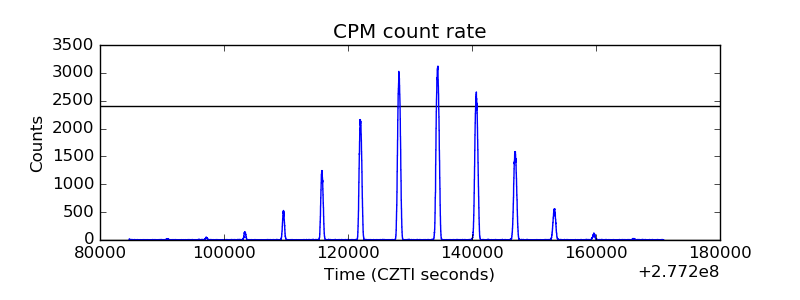 |
| CZT Counter | 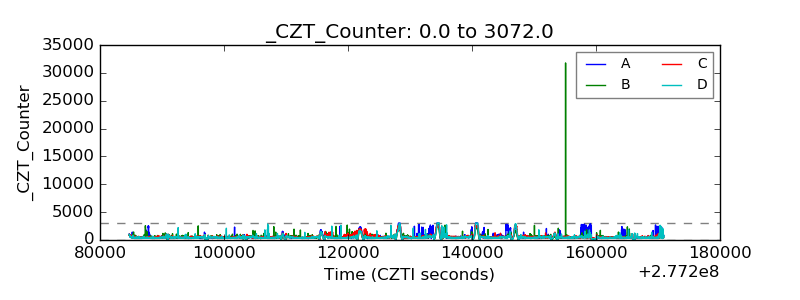 |
| +2.5 Volts monitor |  |
| +5 Volts monitor |  |
| _ROLL_ROT |  |
| _Roll_DEC |  |
| _Roll_RA | 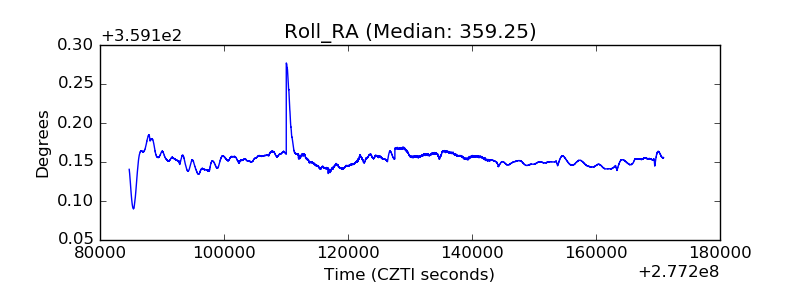 |
| Veto Counter | 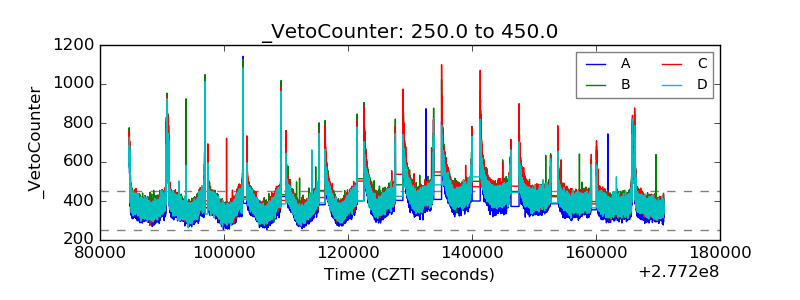 |