| Param | Original file | Final file |
|---|---|---|
| Filename | modeM0/AS1C04_008T01_9000002434cztM0_level2_bc.evt | modeM0/AS1C04_008T01_9000002434cztM0_level2_quad_clean.evt |
| Size (bytes) | 1,235,278,080 | 512,856,000 |
| Size | 1.2 GB | 489.1 MB |
| Events in quadrant A | 8,522,934 | 3,351,762 |
| Events in quadrant B | 9,104,171 | 3,431,002 |
| Events in quadrant C | 7,979,402 | 3,289,452 |
| Events in quadrant D | 9,530,821 | 3,174,577 |
| Mode M0 | |||
|---|---|---|---|
| Quadrant | BADHDUFLAG | Total packets | Discarded packets |
| A | 0 | 74810 | 0 |
| B | 0 | 77134 | 0 |
| C | 0 | 72844 | 0 |
| D | 0 | 77341 | 0 |
| Mode SS | |||
|---|---|---|---|
| Quadrant | BADHDUFLAG | Total packets | Discarded packets |
| A | 0 | 678 | 0 |
| B | 0 | 678 | 0 |
| C | 0 | 678 | 0 |
| D | 0 | 678 | 0 |
| Mode M9 | |||
|---|---|---|---|
| Quadrant | BADHDUFLAG | Total packets | Discarded packets |
| A | 0 | 70 | 0 |
| B | 0 | 70 | 0 |
| C | 0 | 70 | 0 |
| D | 0 | 70 | 0 |
| Quadrant | Total seconds | Saturated seconds | Saturation percentage |
|---|---|---|---|
| A | 33312 | 479 | 1.437920% |
| B | 33312 | 537 | 1.612032% |
| C | 33312 | 515 | 1.545989% |
| D | 33312 | 765 | 2.296470% |
Noise dominated data is calculated using 1-second bins in cleaned event files. If a bin has >2000 counts, and if more than 50% of those come from <1% of pixels, then it is considered to be noise-dominated and hence unusable.
| Quadrant | # 1 sec bins | Bins with >0 counts | Bins with >2000 counts | High rate bins dominated by noise | Noise dominated (total time) | Noise dominated (detector-on time) | Marked lightcurve |
|---|---|---|---|---|---|---|---|
| A | 40203 | 33309 | 10 | 10 | 0.02% | 0.03% |  |
| B | 40203 | 33308 | 7 | 7 | 0.02% | 0.02% |  |
| C | 40203 | 33309 | 2 | 2 | 0.00% | 0.01% |  |
| D | 40203 | 33307 | 79 | 79 | 0.20% | 0.24% | 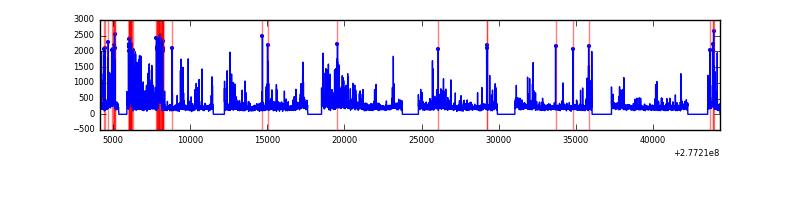 |
Top three noisy pixels from each quadrant. If the there are fewer than three noisy pixels in the level2.evt file, extra rows are filled as -1
| Pixel properties | Quadrant properties | ||||||
|---|---|---|---|---|---|---|---|
| Quadrant | DetID | PixID | Counts | Sigma | Mean | Median | Sigma |
| A | 15 | 174 | 1418354 | 3449.03 | 1850 | 1821 | 410.7 |
| A | 0 | 226 | 12115 | 25.06 | 1850 | 1821 | 410.7 |
| A | 12 | 194 | 11746 | 24.17 | 1850 | 1821 | 410.7 |
| B | 4 | 48 | 453728 | 1233.61 | 1884 | 1848 | 366.3 |
| B | 15 | 35 | 446761 | 1214.59 | 1884 | 1848 | 366.3 |
| B | 4 | 173 | 282654 | 766.59 | 1884 | 1848 | 366.3 |
| C | 3 | 233 | 825163 | 1925.06 | 1802 | 1802 | 427.7 |
| C | 7 | 247 | 206719 | 479.11 | 1802 | 1802 | 427.7 |
| C | 0 | 207 | 23177 | 49.98 | 1802 | 1802 | 427.7 |
| D | 12 | 110 | 752760 | 1764.53 | 1811 | 1754 | 425.6 |
| D | 12 | 218 | 703846 | 1649.6 | 1811 | 1754 | 425.6 |
| D | 2 | 33 | 654163 | 1532.87 | 1811 | 1754 | 425.6 |
Histogram calculated using DETX and DETY for each event in the final _common_clean file
| Quadrant A |  |
 |
Quadrant B |
|---|---|---|---|
| Quadrant D |  |
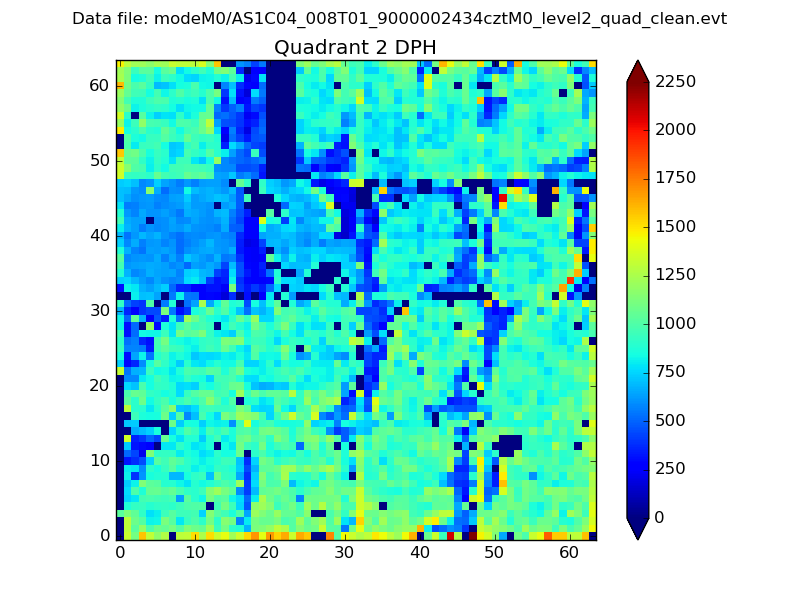 |
Quadrant C |
| Plot type | Count rate plots | Images |
|---|---|---|
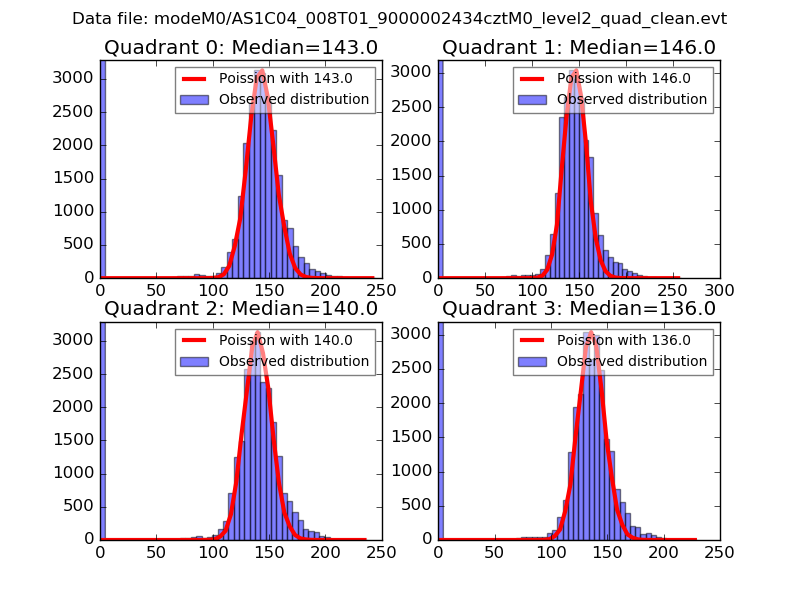
| Comparison with Poisson distribution Blue bars denote a histogram of data divided into 1 sec bins. Red curve is a Poisson curve with rate = median count rate of data. |
 |
 |
| Quadrant-wise count rates Data is divided into 100 sec bins |
 |
|
| Module-wise count rates for Quadrant A Data is divided into 100 sec bins |
 |
 |
| Module-wise count rates for Quadrant B Data is divided into 100 sec bins |
 |
 |
| Module-wise count rates for Quadrant C Data is divided into 100 sec bins |
 |
 |
| Module-wise count rates for Quadrant D Data is divided into 100 sec bins |
 |
 |
| Parameter | Plot |
|---|---|
| CZT HV Monitor |  |
| D_VDD |  |
| Temperature 1 |  |
| Veto HV Monitor |  |
| Veto LLD |  |
| Alpha Counter | 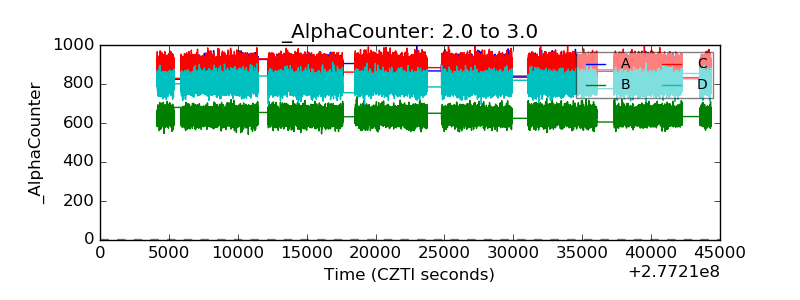 |
| _CPM_Rate |  |
| CZT Counter |  |
| +2.5 Volts monitor |  |
| +5 Volts monitor |  |
| _ROLL_ROT |  |
| _Roll_DEC |  |
| _Roll_RA |  |
| Veto Counter | 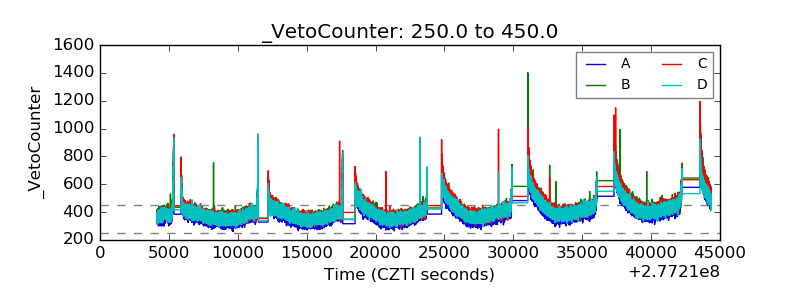 |