| Param | Original file | Final file |
|---|---|---|
| Filename | modeM0/AS1C04_007T03_9000002436cztM0_level2_bc.evt | modeM0/AS1C04_007T03_9000002436cztM0_level2_quad_clean.evt |
| Size (bytes) | 1,042,390,080 | 322,479,360 |
| Size | 994.1 MB | 307.5 MB |
| Events in quadrant A | 7,845,909 | 2,051,737 |
| Events in quadrant B | 9,325,765 | 2,038,741 |
| Events in quadrant C | 6,430,326 | 2,016,811 |
| Events in quadrant D | 6,280,906 | 1,962,000 |
| Mode M0 | |||
|---|---|---|---|
| Quadrant | BADHDUFLAG | Total packets | Discarded packets |
| A | 0 | 61363 | 0 |
| B | 0 | 67317 | 0 |
| C | 0 | 55058 | 0 |
| D | 0 | 54088 | 0 |
| Mode M9 | |||
|---|---|---|---|
| Quadrant | BADHDUFLAG | Total packets | Discarded packets |
| A | 0 | 40 | 0 |
| B | 0 | 40 | 0 |
| C | 0 | 40 | 0 |
| D | 0 | 40 | 0 |
| Mode SS | |||
|---|---|---|---|
| Quadrant | BADHDUFLAG | Total packets | Discarded packets |
| A | 0 | 502 | 0 |
| B | 0 | 502 | 0 |
| C | 0 | 502 | 0 |
| D | 0 | 502 | 0 |
| Quadrant | Total seconds | Saturated seconds | Saturation percentage |
|---|---|---|---|
| A | 24671 | 1060 | 4.296542% |
| B | 24671 | 2296 | 9.306473% |
| C | 24671 | 396 | 1.605123% |
| D | 24671 | 288 | 1.167362% |
Noise dominated data is calculated using 1-second bins in cleaned event files. If a bin has >2000 counts, and if more than 50% of those come from <1% of pixels, then it is considered to be noise-dominated and hence unusable.
| Quadrant | # 1 sec bins | Bins with >0 counts | Bins with >2000 counts | High rate bins dominated by noise | Noise dominated (total time) | Noise dominated (detector-on time) | Marked lightcurve |
|---|---|---|---|---|---|---|---|
| A | 28667 | 24670 | 29 | 29 | 0.10% | 0.12% |  |
| B | 28667 | 24670 | 255 | 255 | 0.89% | 1.03% |  |
| C | 28667 | 24671 | 0 | 0 | 0.00% | 0.00% |  |
| D | 28667 | 24672 | 59 | 59 | 0.21% | 0.24% |  |
Top three noisy pixels from each quadrant. If the there are fewer than three noisy pixels in the level2.evt file, extra rows are filled as -1
| Pixel properties | Quadrant properties | ||||||
|---|---|---|---|---|---|---|---|
| Quadrant | DetID | PixID | Counts | Sigma | Mean | Median | Sigma |
| A | 15 | 174 | 2703119 | 8999.08 | 1334 | 1305 | 300.2 |
| A | 4 | 2 | 27942 | 88.72 | 1334 | 1305 | 300.2 |
| A | 12 | 194 | 8663 | 24.51 | 1334 | 1305 | 300.2 |
| B | 5 | 65 | 2140290 | 8383.86 | 1331 | 1304 | 255.1 |
| B | 10 | 16 | 695738 | 2721.87 | 1331 | 1304 | 255.1 |
| B | 3 | 209 | 393338 | 1536.6 | 1331 | 1304 | 255.1 |
| C | 3 | 233 | 1233759 | 4041.98 | 1299 | 1300 | 304.9 |
| C | 7 | 247 | 177188 | 576.84 | 1299 | 1300 | 304.9 |
| C | 8 | 128 | 12781 | 37.65 | 1299 | 1300 | 304.9 |
| D | 1 | 52 | 519378 | 1677.9 | 1315 | 1269 | 308.8 |
| D | 2 | 33 | 348503 | 1124.52 | 1315 | 1269 | 308.8 |
| D | 2 | 234 | 111657 | 357.49 | 1315 | 1269 | 308.8 |
Histogram calculated using DETX and DETY for each event in the final _common_clean file
| Quadrant A | 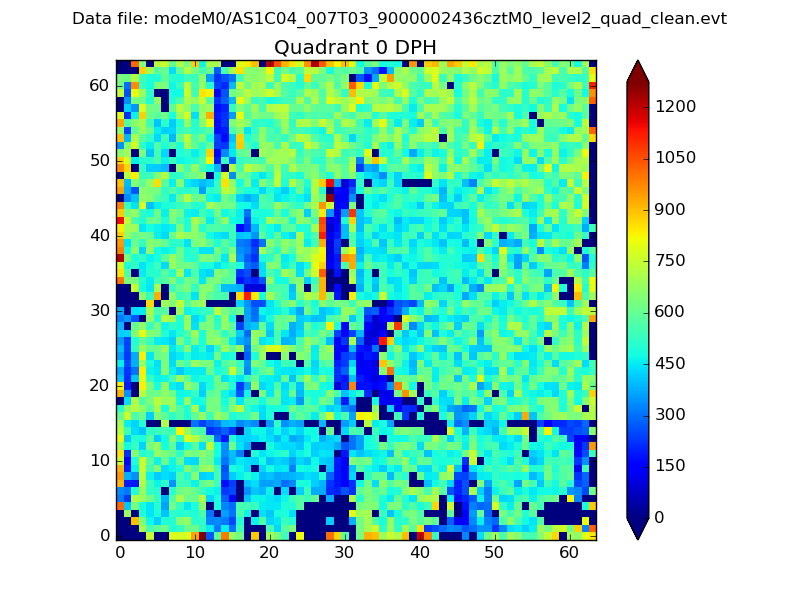 |
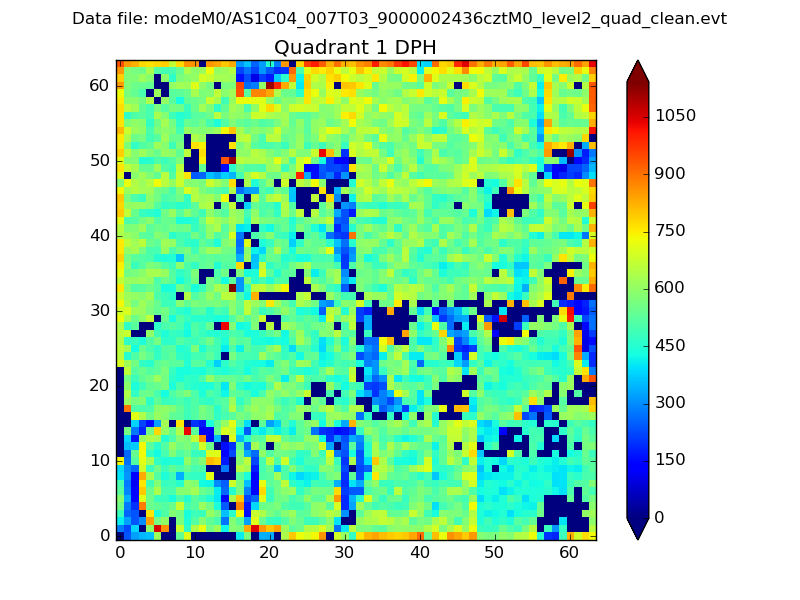 |
Quadrant B |
|---|---|---|---|
| Quadrant D | 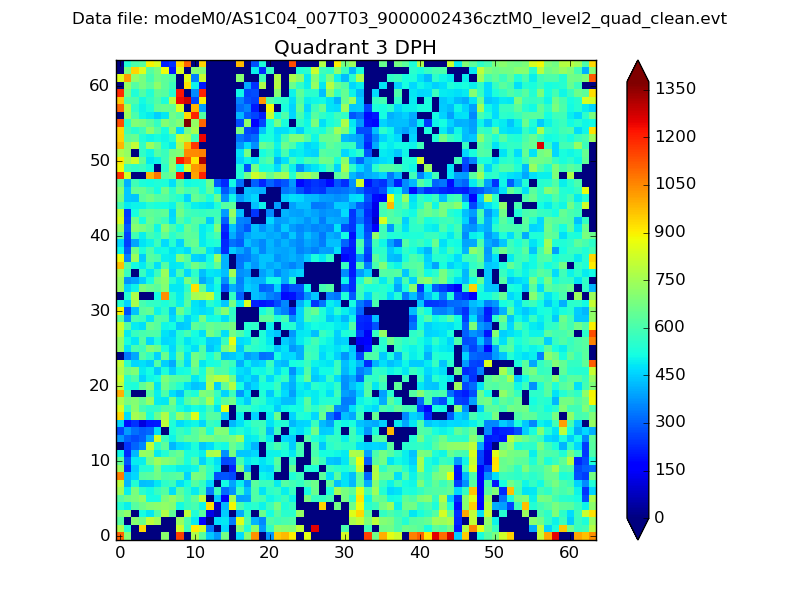 |
 |
Quadrant C |
| Plot type | Count rate plots | Images |
|---|---|---|
| Comparison with Poisson distribution Blue bars denote a histogram of data divided into 1 sec bins. Red curve is a Poisson curve with rate = median count rate of data. |
 |
 |
| Quadrant-wise count rates Data is divided into 100 sec bins |
 |
|
| Module-wise count rates for Quadrant A Data is divided into 100 sec bins |
 |
 |
| Module-wise count rates for Quadrant B Data is divided into 100 sec bins |
 |
 |
| Module-wise count rates for Quadrant C Data is divided into 100 sec bins |
 |
 |
| Module-wise count rates for Quadrant D Data is divided into 100 sec bins |
 |
 |
| Parameter | Plot |
|---|---|
| CZT HV Monitor |  |
| D_VDD |  |
| Temperature 1 |  |
| Veto HV Monitor |  |
| Veto LLD |  |
| Alpha Counter |  |
| _CPM_Rate |  |
| CZT Counter |  |
| +2.5 Volts monitor |  |
| +5 Volts monitor |  |
| _ROLL_ROT |  |
| _Roll_DEC |  |
| _Roll_RA |  |
| Veto Counter |  |