| Param | Original file | Final file |
|---|---|---|
| Filename | modeM0/AS1C04_007T02_9000002432cztM0_level2_bc.evt | modeM0/AS1C04_007T02_9000002432cztM0_level2_quad_clean.evt |
| Size (bytes) | 364,970,880 | 134,256,960 |
| Size | 348.1 MB | 128.0 MB |
| Events in quadrant A | 2,440,592 | 847,572 |
| Events in quadrant B | 2,878,875 | 858,895 |
| Events in quadrant C | 2,238,798 | 824,278 |
| Events in quadrant D | 2,767,250 | 803,538 |
| Mode M0 | |||
|---|---|---|---|
| Quadrant | BADHDUFLAG | Total packets | Discarded packets |
| A | 0 | 23032 | 0 |
| B | 0 | 25143 | 0 |
| C | 0 | 22223 | 0 |
| D | 0 | 24041 | 0 |
| Mode M9 | |||
|---|---|---|---|
| Quadrant | BADHDUFLAG | Total packets | Discarded packets |
| A | 0 | 4 | 0 |
| B | 0 | 4 | 0 |
| C | 0 | 4 | 0 |
| D | 0 | 4 | 0 |
| Mode SS | |||
|---|---|---|---|
| Quadrant | BADHDUFLAG | Total packets | Discarded packets |
| A | 0 | 218 | 0 |
| B | 0 | 218 | 0 |
| C | 0 | 218 | 0 |
| D | 0 | 218 | 0 |
| Quadrant | Total seconds | Saturated seconds | Saturation percentage |
|---|---|---|---|
| A | 10552 | 364 | 3.449583% |
| B | 10552 | 391 | 3.705459% |
| C | 10552 | 320 | 3.032600% |
| D | 10552 | 372 | 3.525398% |
Noise dominated data is calculated using 1-second bins in cleaned event files. If a bin has >2000 counts, and if more than 50% of those come from <1% of pixels, then it is considered to be noise-dominated and hence unusable.
| Quadrant | # 1 sec bins | Bins with >0 counts | Bins with >2000 counts | High rate bins dominated by noise | Noise dominated (total time) | Noise dominated (detector-on time) | Marked lightcurve |
|---|---|---|---|---|---|---|---|
| A | 11058 | 10552 | 9 | 9 | 0.08% | 0.09% |  |
| B | 11058 | 10551 | 1 | 1 | 0.01% | 0.01% |  |
| C | 11058 | 10550 | 0 | 0 | 0.00% | 0.00% | 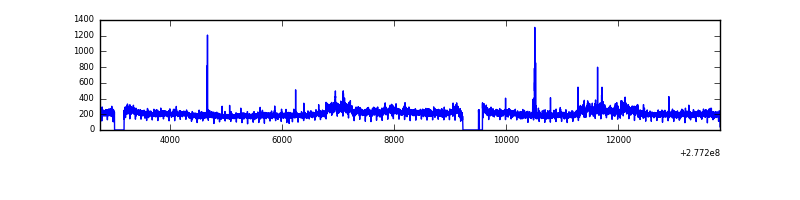 |
| D | 11058 | 10551 | 16 | 16 | 0.14% | 0.15% | 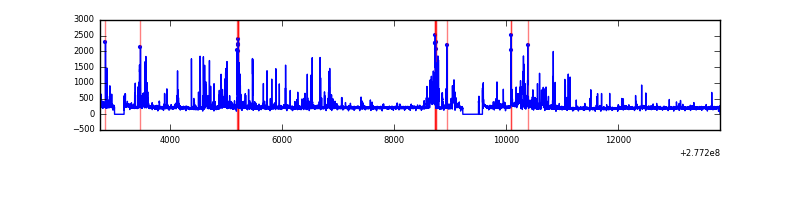 |
Top three noisy pixels from each quadrant. If the there are fewer than three noisy pixels in the level2.evt file, extra rows are filled as -1
| Pixel properties | Quadrant properties | ||||||
|---|---|---|---|---|---|---|---|
| Quadrant | DetID | PixID | Counts | Sigma | Mean | Median | Sigma |
| A | 15 | 174 | 333420 | 2666.86 | 546 | 533 | 124.8 |
| A | 13 | 248 | 6555 | 48.24 | 546 | 533 | 124.8 |
| A | 12 | 194 | 3573 | 24.35 | 546 | 533 | 124.8 |
| B | 15 | 35 | 439312 | 3943.26 | 551 | 537 | 111.3 |
| B | 4 | 173 | 71169 | 634.77 | 551 | 537 | 111.3 |
| B | 0 | 198 | 63741 | 568.01 | 551 | 537 | 111.3 |
| C | 3 | 233 | 170477 | 1344.93 | 526 | 522 | 126.4 |
| C | 0 | 207 | 19183 | 147.67 | 526 | 522 | 126.4 |
| C | 8 | 128 | 9889 | 74.13 | 526 | 522 | 126.4 |
| D | 2 | 33 | 259179 | 2006.52 | 534 | 513 | 128.9 |
| D | 1 | 52 | 228804 | 1770.89 | 534 | 513 | 128.9 |
| D | 5 | 222 | 133288 | 1029.96 | 534 | 513 | 128.9 |
Histogram calculated using DETX and DETY for each event in the final _common_clean file
| Quadrant A |  |
 |
Quadrant B |
|---|---|---|---|
| Quadrant D |  |
 |
Quadrant C |
| Plot type | Count rate plots | Images |
|---|---|---|
| Comparison with Poisson distribution Blue bars denote a histogram of data divided into 1 sec bins. Red curve is a Poisson curve with rate = median count rate of data. |
 |
 |
| Quadrant-wise count rates Data is divided into 100 sec bins |
 |
|
| Module-wise count rates for Quadrant A Data is divided into 100 sec bins |
 |
 |
| Module-wise count rates for Quadrant B Data is divided into 100 sec bins |
 |
 |
| Module-wise count rates for Quadrant C Data is divided into 100 sec bins |
 |
 |
| Module-wise count rates for Quadrant D Data is divided into 100 sec bins |
 |
 |
| Parameter | Plot |
|---|---|
| CZT HV Monitor |  |
| D_VDD |  |
| Temperature 1 |  |
| Veto HV Monitor |  |
| Veto LLD |  |
| Alpha Counter |  |
| _CPM_Rate |  |
| CZT Counter | 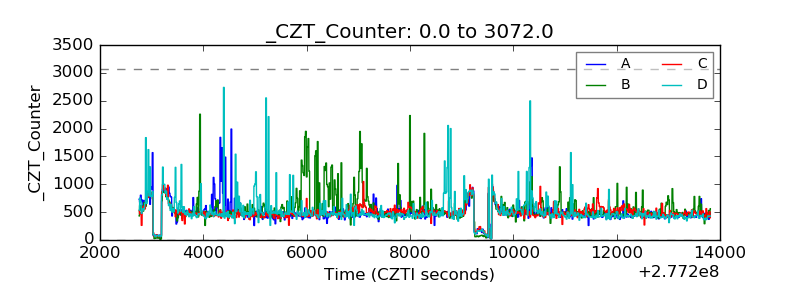 |
| +2.5 Volts monitor |  |
| +5 Volts monitor |  |
| _ROLL_ROT |  |
| _Roll_DEC |  |
| _Roll_RA |  |
| Veto Counter |  |