| Param | Original file | Final file |
|---|---|---|
| Filename | modeM0/AS1C04_007T04_9000002430cztM0_level2_bc.evt | modeM0/AS1C04_007T04_9000002430cztM0_level2_quad_clean.evt |
| Size (bytes) | 2,720,283,840 | 925,571,520 |
| Size | 2.5 GB | 882.7 MB |
| Events in quadrant A | 16,155,163 | 5,780,090 |
| Events in quadrant B | 19,907,467 | 5,901,468 |
| Events in quadrant C | 16,178,780 | 5,778,822 |
| Events in quadrant D | 25,061,377 | 5,462,066 |
| Mode M0 | |||
|---|---|---|---|
| Quadrant | BADHDUFLAG | Total packets | Discarded packets |
| A | 0 | 158177 | 0 |
| B | 0 | 171746 | 0 |
| C | 0 | 156859 | 0 |
| D | 0 | 189741 | 0 |
| Mode SS | |||
|---|---|---|---|
| Quadrant | BADHDUFLAG | Total packets | Discarded packets |
| A | 0 | 1522 | 0 |
| B | 0 | 1522 | 0 |
| C | 0 | 1522 | 0 |
| D | 0 | 1522 | 0 |
| Mode M9 | |||
|---|---|---|---|
| Quadrant | BADHDUFLAG | Total packets | Discarded packets |
| A | 0 | 117 | 0 |
| B | 0 | 117 | 0 |
| C | 0 | 117 | 0 |
| D | 0 | 117 | 0 |
| Quadrant | Total seconds | Saturated seconds | Saturation percentage |
|---|---|---|---|
| A | 74556 | 1118 | 1.499544% |
| B | 74556 | 1662 | 2.229197% |
| C | 74556 | 1391 | 1.865712% |
| D | 74556 | 3822 | 5.126348% |
Noise dominated data is calculated using 1-second bins in cleaned event files. If a bin has >2000 counts, and if more than 50% of those come from <1% of pixels, then it is considered to be noise-dominated and hence unusable.
| Quadrant | # 1 sec bins | Bins with >0 counts | Bins with >2000 counts | High rate bins dominated by noise | Noise dominated (total time) | Noise dominated (detector-on time) | Marked lightcurve |
|---|---|---|---|---|---|---|---|
| A | 86257 | 74550 | 16 | 16 | 0.02% | 0.02% |  |
| B | 86257 | 74549 | 29 | 29 | 0.03% | 0.04% |  |
| C | 86257 | 74554 | 15 | 15 | 0.02% | 0.02% |  |
| D | 86257 | 74550 | 877 | 877 | 1.02% | 1.18% | 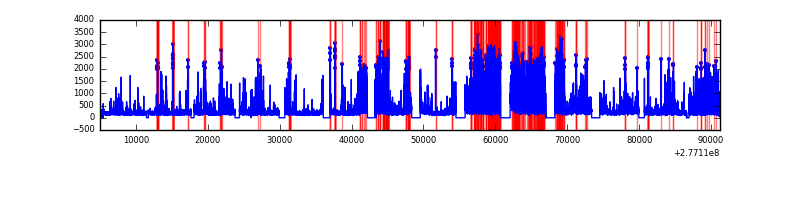 |
Top three noisy pixels from each quadrant. If the there are fewer than three noisy pixels in the level2.evt file, extra rows are filled as -1
| Pixel properties | Quadrant properties | ||||||
|---|---|---|---|---|---|---|---|
| Quadrant | DetID | PixID | Counts | Sigma | Mean | Median | Sigma |
| A | 15 | 174 | 1310442 | 1561.24 | 3842 | 3768 | 836.9 |
| A | 3 | 1 | 52449 | 58.16 | 3842 | 3768 | 836.9 |
| A | 13 | 248 | 39812 | 43.07 | 3842 | 3768 | 836.9 |
| B | 15 | 35 | 1232589 | 1669.88 | 3916 | 3808 | 735.9 |
| B | 7 | 220 | 609782 | 823.5 | 3916 | 3808 | 735.9 |
| B | 0 | 198 | 521251 | 703.19 | 3916 | 3808 | 735.9 |
| C | 3 | 233 | 1262873 | 1436.73 | 3754 | 3728 | 876.4 |
| C | 7 | 247 | 276867 | 311.66 | 3754 | 3728 | 876.4 |
| C | 0 | 207 | 199617 | 223.52 | 3754 | 3728 | 876.4 |
| D | 1 | 52 | 7356860 | 8528.36 | 3718 | 3578 | 862.2 |
| D | 2 | 33 | 1104058 | 1276.34 | 3718 | 3578 | 862.2 |
| D | 12 | 218 | 944660 | 1091.47 | 3718 | 3578 | 862.2 |
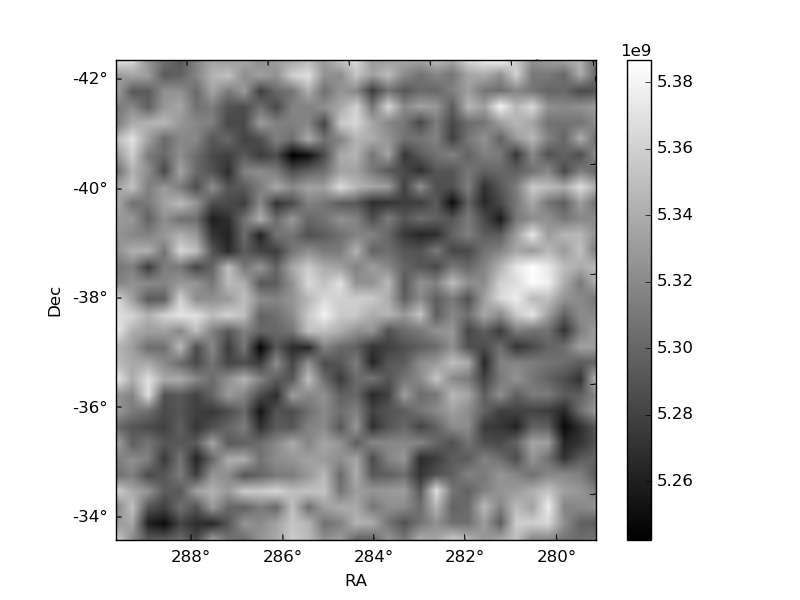
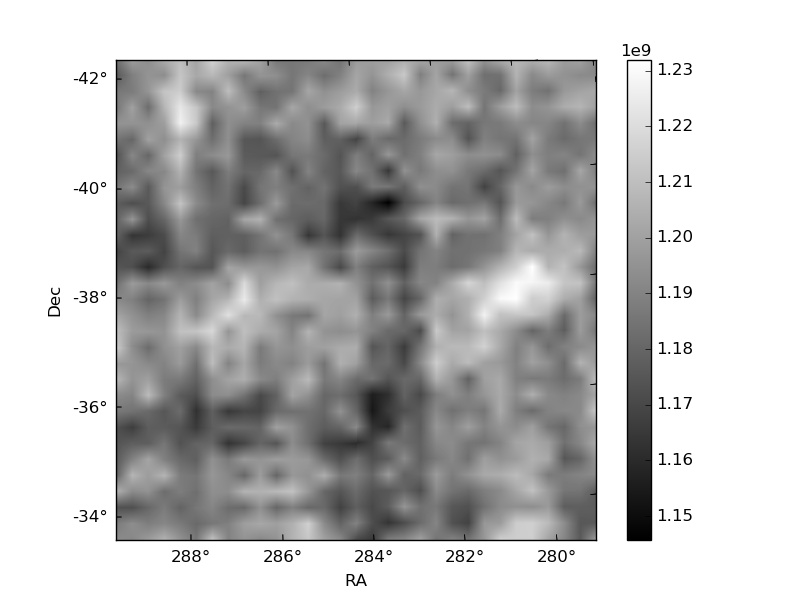
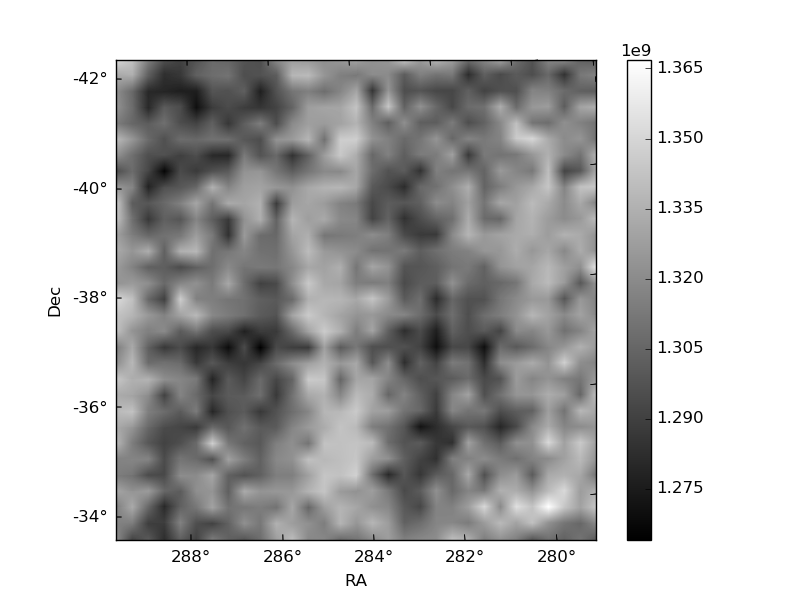
Histogram calculated using DETX and DETY for each event in the final _common_clean file
| Quadrant A |  |
 |
Quadrant B |
|---|---|---|---|
| Quadrant D |  |
 |
Quadrant C |
| Plot type | Count rate plots | Images |
|---|---|---|
| Comparison with Poisson distribution Blue bars denote a histogram of data divided into 1 sec bins. Red curve is a Poisson curve with rate = median count rate of data. |
 |
 |
| Quadrant-wise count rates Data is divided into 100 sec bins |
 |
|
| Module-wise count rates for Quadrant A Data is divided into 100 sec bins |
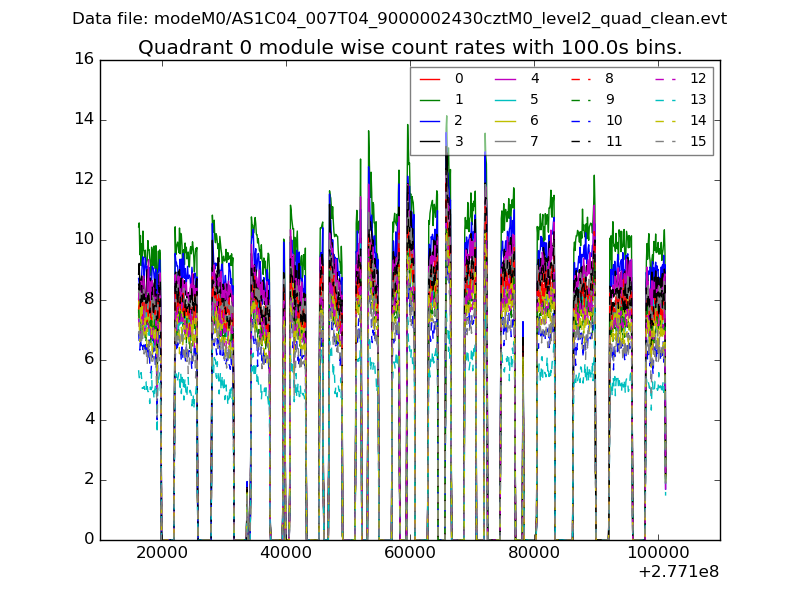 |
 |
| Module-wise count rates for Quadrant B Data is divided into 100 sec bins |
 |
 |
| Module-wise count rates for Quadrant C Data is divided into 100 sec bins |
 |
 |
| Module-wise count rates for Quadrant D Data is divided into 100 sec bins |
 |
 |
| Parameter | Plot |
|---|---|
| CZT HV Monitor |  |
| D_VDD |  |
| Temperature 1 | 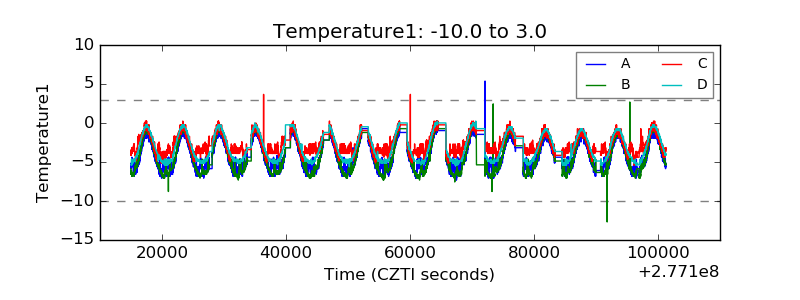 |
| Veto HV Monitor |  |
| Veto LLD | 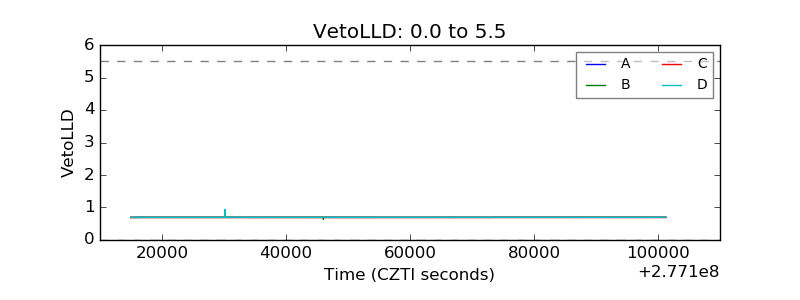 |
| Alpha Counter | 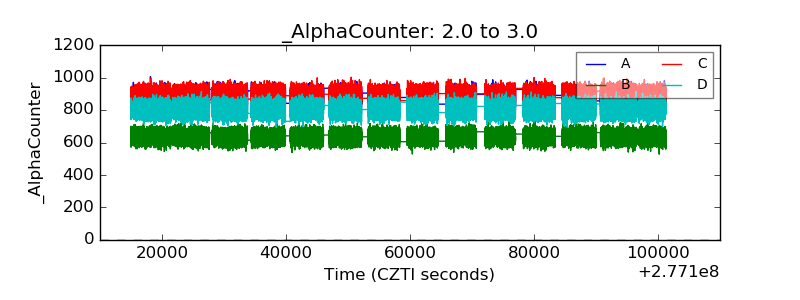 |
| _CPM_Rate |  |
| CZT Counter |  |
| +2.5 Volts monitor |  |
| +5 Volts monitor |  |
| _ROLL_ROT |  |
| _Roll_DEC |  |
| _Roll_RA |  |
| Veto Counter |  |