| Param | Original file | Final file |
|---|---|---|
| Filename | modeM0/AS1A05_069T04_9000002428cztM0_level2_bc.evt | modeM0/AS1A05_069T04_9000002428cztM0_level2_quad_clean.evt |
| Size (bytes) | 2,674,834,560 | 792,466,560 |
| Size | 2.5 GB | 755.8 MB |
| Events in quadrant A | 20,181,839 | 4,714,422 |
| Events in quadrant B | 16,908,130 | 5,198,634 |
| Events in quadrant C | 22,464,135 | 4,837,670 |
| Events in quadrant D | 16,996,560 | 4,768,097 |
| Mode SS | |||
|---|---|---|---|
| Quadrant | BADHDUFLAG | Total packets | Discarded packets |
| A | 0 | 1334 | 0 |
| B | 0 | 1334 | 0 |
| C | 0 | 1334 | 0 |
| D | 0 | 1334 | 0 |
| Mode M0 | |||
|---|---|---|---|
| Quadrant | BADHDUFLAG | Total packets | Discarded packets |
| A | 0 | 186996 | 0 |
| B | 0 | 147950 | 0 |
| C | 0 | 177600 | 0 |
| D | 0 | 145992 | 0 |
| Mode M9 | |||
|---|---|---|---|
| Quadrant | BADHDUFLAG | Total packets | Discarded packets |
| A | 0 | 109 | 0 |
| B | 0 | 109 | 0 |
| C | 0 | 109 | 0 |
| D | 0 | 109 | 0 |
| Quadrant | Total seconds | Saturated seconds | Saturation percentage |
|---|---|---|---|
| A | 65327 | 8487 | 12.991566% |
| B | 65327 | 1130 | 1.729760% |
| C | 65327 | 3889 | 5.953128% |
| D | 65327 | 898 | 1.374623% |
Noise dominated data is calculated using 1-second bins in cleaned event files. If a bin has >2000 counts, and if more than 50% of those come from <1% of pixels, then it is considered to be noise-dominated and hence unusable.
| Quadrant | # 1 sec bins | Bins with >0 counts | Bins with >2000 counts | High rate bins dominated by noise | Noise dominated (total time) | Noise dominated (detector-on time) | Marked lightcurve |
|---|---|---|---|---|---|---|---|
| A | 76613 | 65296 | 575 | 575 | 0.75% | 0.88% |  |
| B | 76613 | 65320 | 49 | 49 | 0.06% | 0.08% |  |
| C | 76613 | 65320 | 80 | 80 | 0.10% | 0.12% |  |
| D | 76613 | 65322 | 77 | 77 | 0.10% | 0.12% |  |
Top three noisy pixels from each quadrant. If the there are fewer than three noisy pixels in the level2.evt file, extra rows are filled as -1
| Pixel properties | Quadrant properties | ||||||
|---|---|---|---|---|---|---|---|
| Quadrant | DetID | PixID | Counts | Sigma | Mean | Median | Sigma |
| A | 15 | 174 | 8281549 | 12485.64 | 3068 | 3010 | 663.0 |
| A | 3 | 1 | 57778 | 82.6 | 3068 | 3010 | 663.0 |
| A | 15 | 223 | 52639 | 74.85 | 3068 | 3010 | 663.0 |
| B | 15 | 35 | 1015951 | 1580.57 | 3422 | 3334 | 640.7 |
| B | 0 | 229 | 581649 | 902.68 | 3422 | 3334 | 640.7 |
| B | 0 | 198 | 433152 | 670.89 | 3422 | 3334 | 640.7 |
| C | 3 | 233 | 5877474 | 7762.93 | 3189 | 3166 | 756.7 |
| C | 4 | 254 | 4050707 | 5348.85 | 3189 | 3166 | 756.7 |
| C | 7 | 247 | 216349 | 281.72 | 3189 | 3166 | 756.7 |
| D | 5 | 222 | 1934925 | 2558.81 | 3290 | 3174 | 754.9 |
| D | 1 | 52 | 803997 | 1060.78 | 3290 | 3174 | 754.9 |
| D | 12 | 218 | 649362 | 855.94 | 3290 | 3174 | 754.9 |
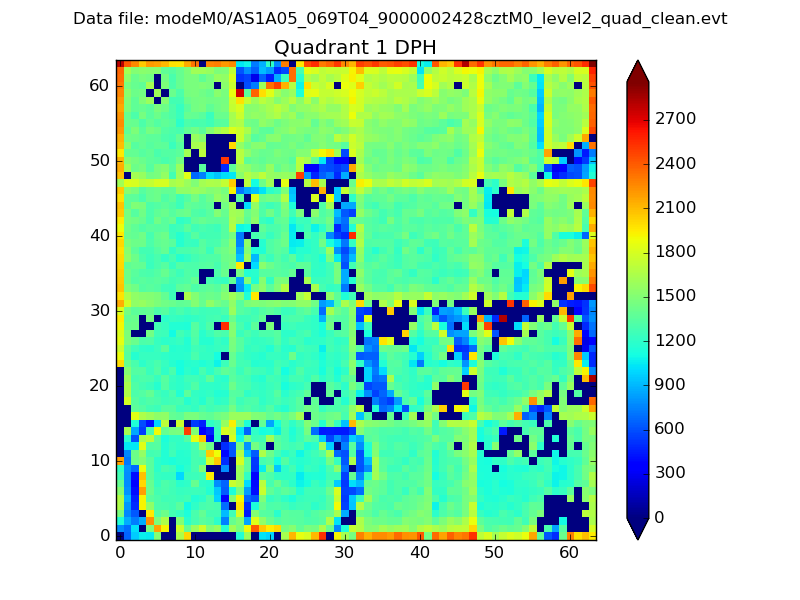
Histogram calculated using DETX and DETY for each event in the final _common_clean file
| Quadrant A |  |
 |
Quadrant B |
|---|---|---|---|
| Quadrant D |  |
 |
Quadrant C |
| Plot type | Count rate plots | Images |
|---|---|---|
| Comparison with Poisson distribution Blue bars denote a histogram of data divided into 1 sec bins. Red curve is a Poisson curve with rate = median count rate of data. |
 |
 |
| Quadrant-wise count rates Data is divided into 100 sec bins |
 |
|
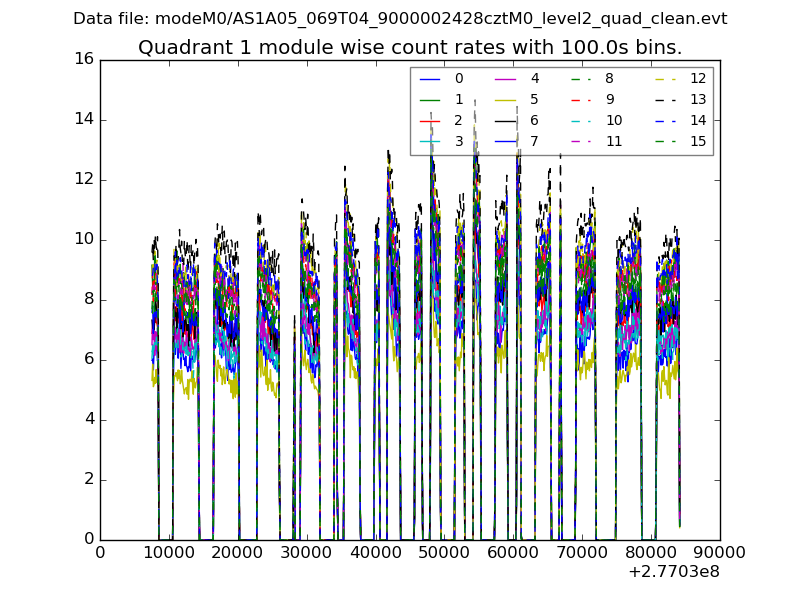
| Module-wise count rates for Quadrant A Data is divided into 100 sec bins |
 |
 |
| Module-wise count rates for Quadrant B Data is divided into 100 sec bins |
 |
 |
| Module-wise count rates for Quadrant C Data is divided into 100 sec bins |
 |
 |
| Module-wise count rates for Quadrant D Data is divided into 100 sec bins |
 |
 |
| Parameter | Plot |
|---|---|
| CZT HV Monitor |  |
| D_VDD |  |
| Temperature 1 |  |
| Veto HV Monitor | 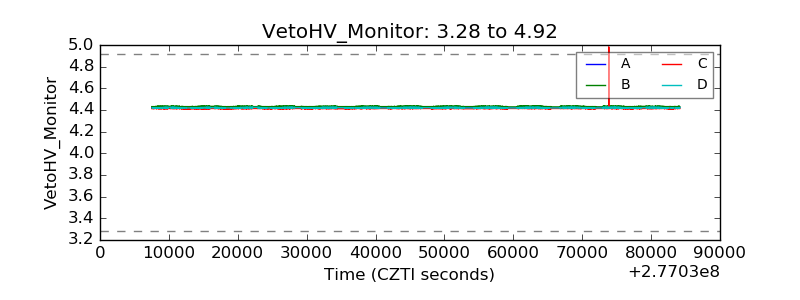 |
| Veto LLD | 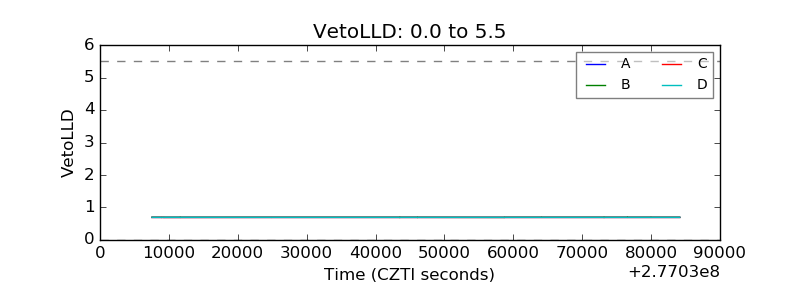 |
| Alpha Counter |  |
| _CPM_Rate |  |
| CZT Counter |  |
| +2.5 Volts monitor |  |
| +5 Volts monitor |  |
| _ROLL_ROT |  |
| _Roll_DEC |  |
| _Roll_RA |  |
| Veto Counter |  |