| Param | Original file | Final file |
|---|---|---|
| Filename | modeM0/AS1A05_069T01_9000002424cztM0_level2_bc.evt | modeM0/AS1A05_069T01_9000002424cztM0_level2_quad_clean.evt |
| Size (bytes) | 2,392,136,640 | 808,424,640 |
| Size | 2.2 GB | 771.0 MB |
| Events in quadrant A | 14,413,030 | 5,092,757 |
| Events in quadrant B | 17,076,464 | 5,205,032 |
| Events in quadrant C | 14,379,207 | 4,936,216 |
| Events in quadrant D | 22,092,850 | 4,740,007 |
| Mode M0 | |||
|---|---|---|---|
| Quadrant | BADHDUFLAG | Total packets | Discarded packets |
| A | 0 | 139973 | 0 |
| B | 0 | 149942 | 0 |
| C | 0 | 139916 | 0 |
| D | 0 | 165687 | 0 |
| Mode M9 | |||
|---|---|---|---|
| Quadrant | BADHDUFLAG | Total packets | Discarded packets |
| A | 0 | 107 | 0 |
| B | 0 | 107 | 0 |
| C | 0 | 107 | 0 |
| D | 0 | 107 | 0 |
| Mode SS | |||
|---|---|---|---|
| Quadrant | BADHDUFLAG | Total packets | Discarded packets |
| A | 0 | 1336 | 0 |
| B | 0 | 1336 | 0 |
| C | 0 | 1336 | 0 |
| D | 0 | 1336 | 0 |
| Quadrant | Total seconds | Saturated seconds | Saturation percentage |
|---|---|---|---|
| A | 65806 | 1293 | 1.964866% |
| B | 65806 | 1654 | 2.513449% |
| C | 65806 | 1283 | 1.949670% |
| D | 65806 | 2404 | 3.653162% |
Noise dominated data is calculated using 1-second bins in cleaned event files. If a bin has >2000 counts, and if more than 50% of those come from <1% of pixels, then it is considered to be noise-dominated and hence unusable.
| Quadrant | # 1 sec bins | Bins with >0 counts | Bins with >2000 counts | High rate bins dominated by noise | Noise dominated (total time) | Noise dominated (detector-on time) | Marked lightcurve |
|---|---|---|---|---|---|---|---|
| A | 76423 | 65809 | 19 | 19 | 0.02% | 0.03% |  |
| B | 76423 | 65804 | 63 | 63 | 0.08% | 0.10% | 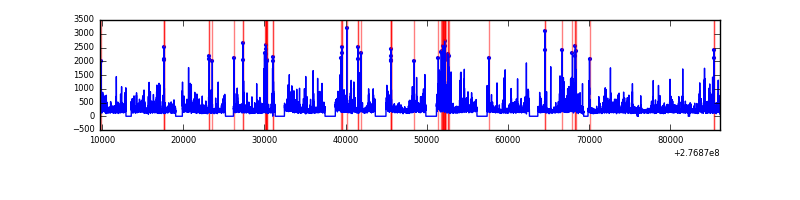 |
| C | 76423 | 65806 | 6 | 6 | 0.01% | 0.01% | 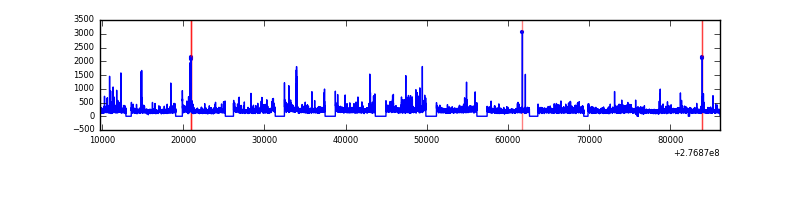 |
| D | 76423 | 65805 | 215 | 215 | 0.28% | 0.33% |  |
Top three noisy pixels from each quadrant. If the there are fewer than three noisy pixels in the level2.evt file, extra rows are filled as -1
| Pixel properties | Quadrant properties | ||||||
|---|---|---|---|---|---|---|---|
| Quadrant | DetID | PixID | Counts | Sigma | Mean | Median | Sigma |
| A | 15 | 174 | 946182 | 1287.38 | 3408 | 3347 | 732.4 |
| A | 9 | 143 | 236332 | 318.13 | 3408 | 3347 | 732.4 |
| A | 15 | 223 | 113266 | 150.09 | 3408 | 3347 | 732.4 |
| B | 10 | 16 | 737286 | 1131.99 | 3467 | 3375 | 648.3 |
| B | 15 | 35 | 672960 | 1032.78 | 3467 | 3375 | 648.3 |
| B | 0 | 198 | 443032 | 678.13 | 3467 | 3375 | 648.3 |
| C | 3 | 233 | 1247365 | 1617.06 | 3297 | 3279 | 769.3 |
| C | 7 | 247 | 217513 | 278.46 | 3297 | 3279 | 769.3 |
| C | 0 | 207 | 132572 | 168.05 | 3297 | 3279 | 769.3 |
| D | 1 | 20 | 4274761 | 5627.36 | 3305 | 3184 | 759.1 |
| D | 12 | 218 | 2129864 | 2801.68 | 3305 | 3184 | 759.1 |
| D | 7 | 38 | 799968 | 1049.68 | 3305 | 3184 | 759.1 |
Histogram calculated using DETX and DETY for each event in the final _common_clean file
| Quadrant A |  |
 |
Quadrant B |
|---|---|---|---|
| Quadrant D |  |
 |
Quadrant C |
| Plot type | Count rate plots | Images |
|---|---|---|
| Comparison with Poisson distribution Blue bars denote a histogram of data divided into 1 sec bins. Red curve is a Poisson curve with rate = median count rate of data. |
 |
 |
| Quadrant-wise count rates Data is divided into 100 sec bins |
 |
|
| Module-wise count rates for Quadrant A Data is divided into 100 sec bins |
 |
 |
| Module-wise count rates for Quadrant B Data is divided into 100 sec bins |
 |
 |
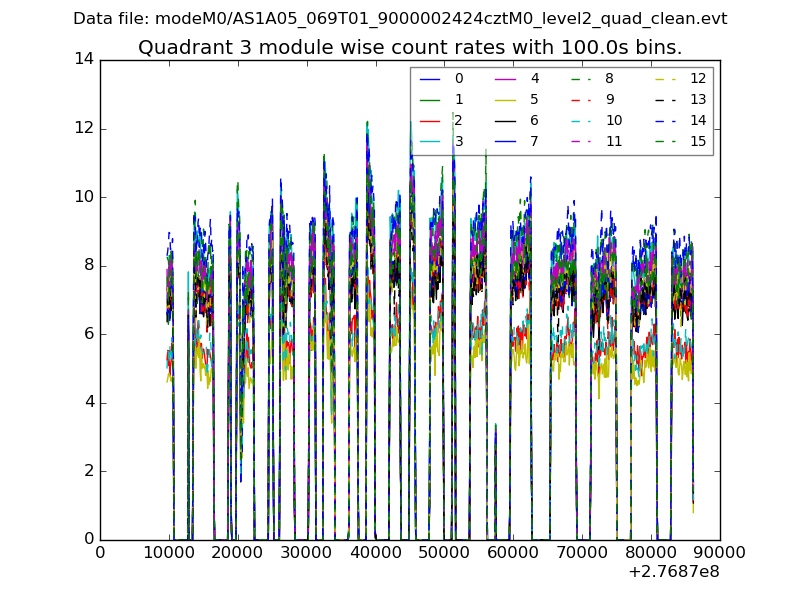
| Module-wise count rates for Quadrant C Data is divided into 100 sec bins |
 |
 |
| Module-wise count rates for Quadrant D Data is divided into 100 sec bins |
 |
 |
| Parameter | Plot |
|---|---|
| CZT HV Monitor |  |
| D_VDD |  |
| Temperature 1 |  |
| Veto HV Monitor |  |
| Veto LLD |  |
| Alpha Counter |  |
| _CPM_Rate |  |
| CZT Counter |  |
| +2.5 Volts monitor | 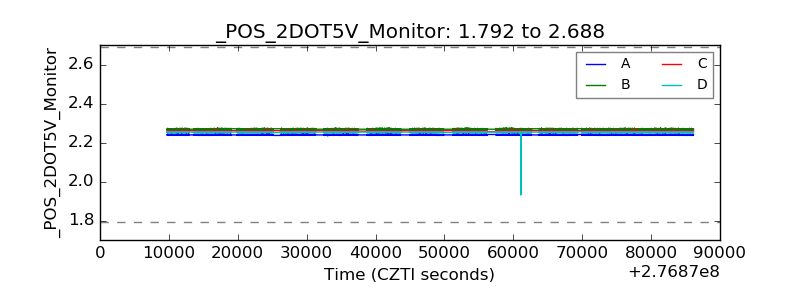 |
| +5 Volts monitor |  |
| _ROLL_ROT | 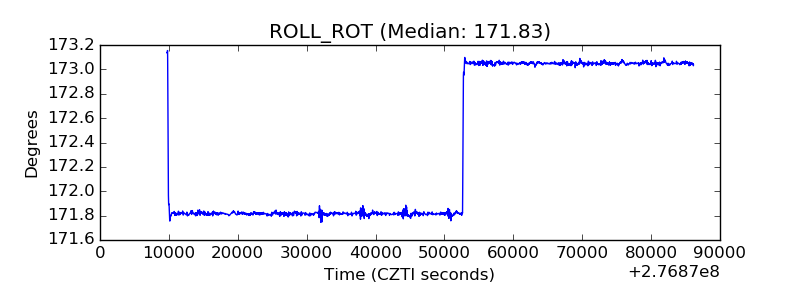 |
| _Roll_DEC | 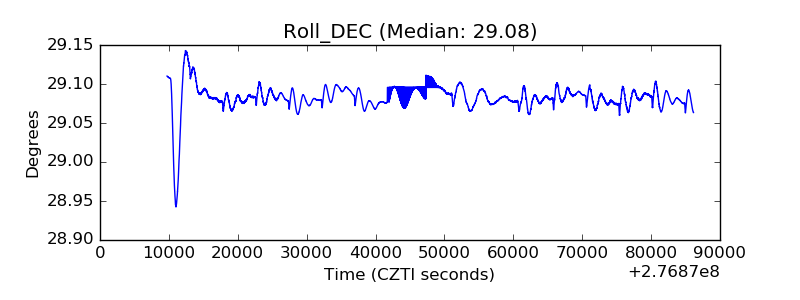 |
| _Roll_RA |  |
| Veto Counter |  |