| Param | Original file | Final file |
|---|---|---|
| Filename | modeM0/AS1A05_069T05_9000002420cztM0_level2_bc.evt | modeM0/AS1A05_069T05_9000002420cztM0_level2_quad_clean.evt |
| Size (bytes) | 2,317,872,960 | 829,442,880 |
| Size | 2.2 GB | 791.0 MB |
| Events in quadrant A | 15,280,451 | 5,257,276 |
| Events in quadrant B | 17,790,677 | 5,354,537 |
| Events in quadrant C | 14,036,408 | 5,085,147 |
| Events in quadrant D | 18,583,887 | 4,893,493 |
| Mode M0 | |||
|---|---|---|---|
| Quadrant | BADHDUFLAG | Total packets | Discarded packets |
| A | 0 | 141908 | 0 |
| B | 0 | 152220 | 0 |
| C | 0 | 138371 | 0 |
| D | 0 | 155866 | 0 |
| Mode SS | |||
|---|---|---|---|
| Quadrant | BADHDUFLAG | Total packets | Discarded packets |
| A | 0 | 1348 | 0 |
| B | 0 | 1348 | 0 |
| C | 0 | 1348 | 0 |
| D | 0 | 1348 | 0 |
| Mode M9 | |||
|---|---|---|---|
| Quadrant | BADHDUFLAG | Total packets | Discarded packets |
| A | 0 | 103 | 0 |
| B | 0 | 103 | 0 |
| C | 0 | 103 | 0 |
| D | 0 | 103 | 0 |
| Quadrant | Total seconds | Saturated seconds | Saturation percentage |
|---|---|---|---|
| A | 66095 | 1112 | 1.682427% |
| B | 66095 | 1438 | 2.175656% |
| C | 66095 | 997 | 1.508435% |
| D | 66095 | 1582 | 2.393524% |
Noise dominated data is calculated using 1-second bins in cleaned event files. If a bin has >2000 counts, and if more than 50% of those come from <1% of pixels, then it is considered to be noise-dominated and hence unusable.
| Quadrant | # 1 sec bins | Bins with >0 counts | Bins with >2000 counts | High rate bins dominated by noise | Noise dominated (total time) | Noise dominated (detector-on time) | Marked lightcurve |
|---|---|---|---|---|---|---|---|
| A | 76436 | 66096 | 37 | 37 | 0.05% | 0.06% |  |
| B | 76436 | 66096 | 58 | 58 | 0.08% | 0.09% |  |
| C | 76436 | 66097 | 1 | 1 | 0.00% | 0.00% |  |
| D | 76436 | 66096 | 53 | 53 | 0.07% | 0.08% |  |
Top three noisy pixels from each quadrant. If the there are fewer than three noisy pixels in the level2.evt file, extra rows are filled as -1
| Pixel properties | Quadrant properties | ||||||
|---|---|---|---|---|---|---|---|
| Quadrant | DetID | PixID | Counts | Sigma | Mean | Median | Sigma |
| A | 15 | 174 | 1086325 | 1472.59 | 3447 | 3382 | 735.4 |
| A | 9 | 143 | 517503 | 699.1 | 3447 | 3382 | 735.4 |
| A | 15 | 223 | 309039 | 415.63 | 3447 | 3382 | 735.4 |
| B | 10 | 16 | 1103081 | 1659.66 | 3513 | 3421 | 662.6 |
| B | 15 | 35 | 845519 | 1270.94 | 3513 | 3421 | 662.6 |
| B | 0 | 189 | 527309 | 790.68 | 3513 | 3421 | 662.6 |
| C | 3 | 233 | 1083925 | 1394.54 | 3334 | 3316 | 774.9 |
| C | 10 | 169 | 71487 | 87.98 | 3334 | 3316 | 774.9 |
| C | 8 | 128 | 25012 | 28.0 | 3334 | 3316 | 774.9 |
| D | 2 | 122 | 2976699 | 3845.1 | 3354 | 3235 | 773.3 |
| D | 10 | 70 | 1158265 | 1493.61 | 3354 | 3235 | 773.3 |
| D | 12 | 218 | 1041680 | 1342.85 | 3354 | 3235 | 773.3 |
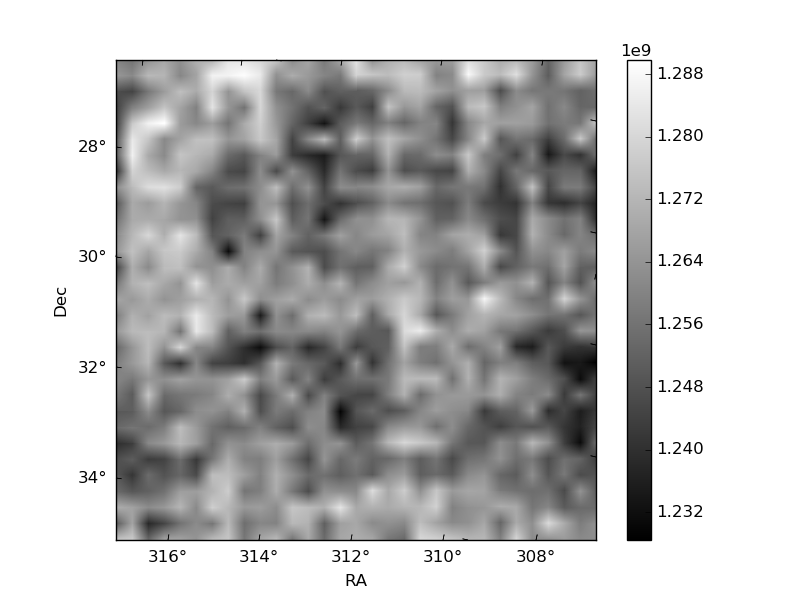
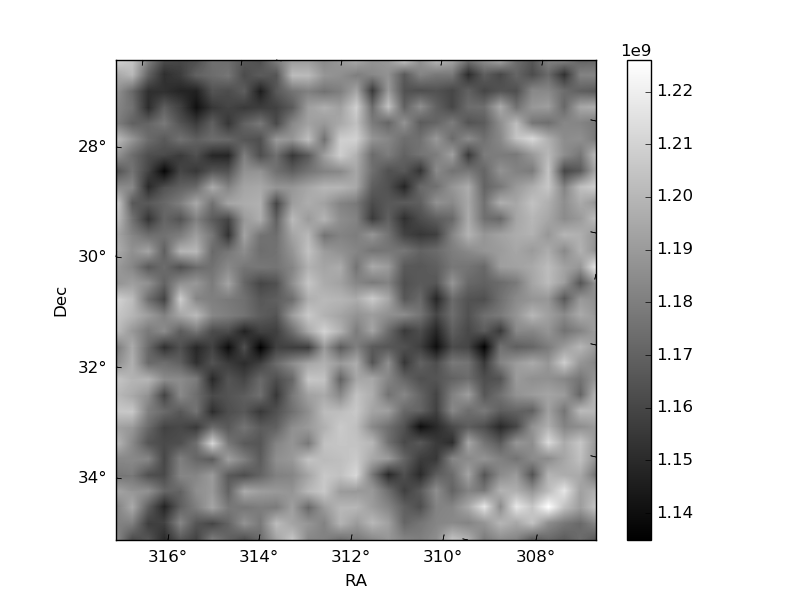
Histogram calculated using DETX and DETY for each event in the final _common_clean file
| Quadrant A |  |
 |
Quadrant B |
|---|---|---|---|
| Quadrant D |  |
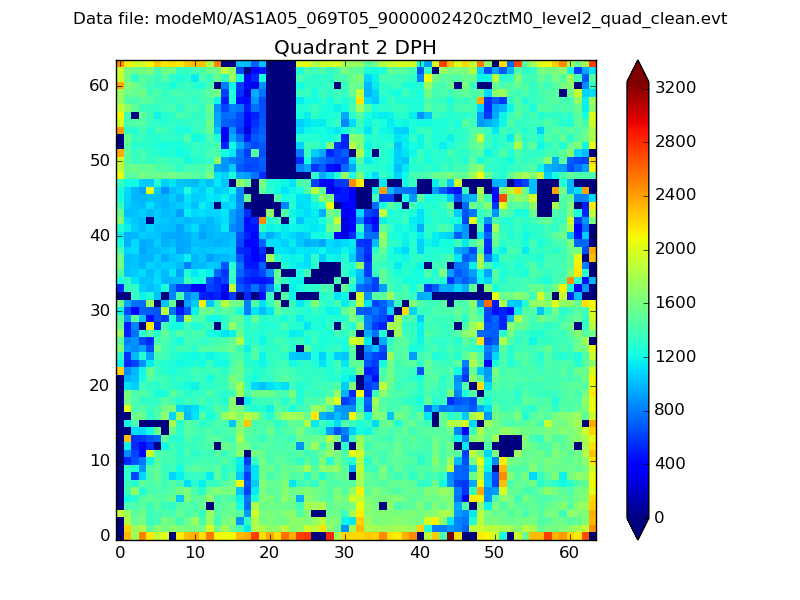 |
Quadrant C |
| Plot type | Count rate plots | Images |
|---|---|---|
| Comparison with Poisson distribution Blue bars denote a histogram of data divided into 1 sec bins. Red curve is a Poisson curve with rate = median count rate of data. |
 |
 |
| Quadrant-wise count rates Data is divided into 100 sec bins |
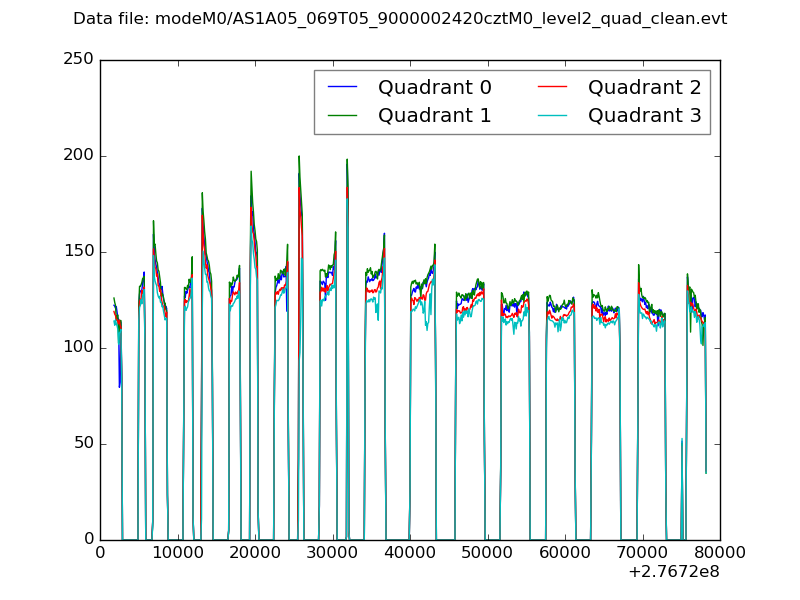 |
|
| Module-wise count rates for Quadrant A Data is divided into 100 sec bins |
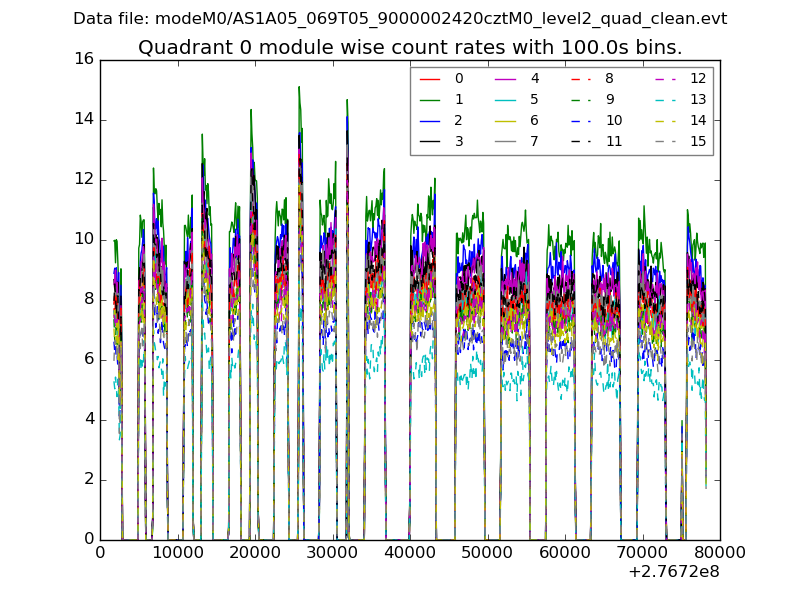 |
 |
| Module-wise count rates for Quadrant B Data is divided into 100 sec bins |
 |
 |
| Module-wise count rates for Quadrant C Data is divided into 100 sec bins |
 |
 |
| Module-wise count rates for Quadrant D Data is divided into 100 sec bins |
 |
 |
| Parameter | Plot |
|---|---|
| CZT HV Monitor |  |
| D_VDD |  |
| Temperature 1 |  |
| Veto HV Monitor |  |
| Veto LLD |  |
| Alpha Counter | 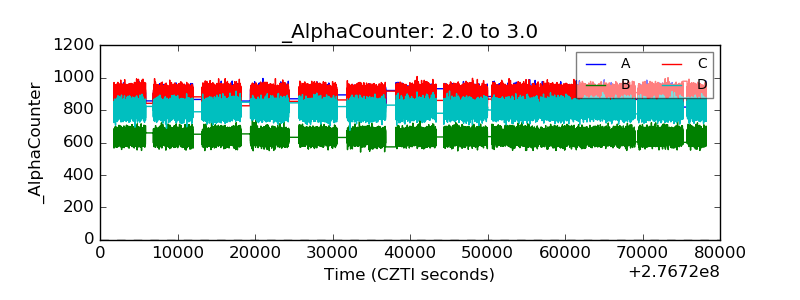 |
| _CPM_Rate |  |
| CZT Counter |  |
| +2.5 Volts monitor |  |
| +5 Volts monitor |  |
| _ROLL_ROT |  |
| _Roll_DEC |  |
| _Roll_RA |  |
| Veto Counter |  |