| Param | Original file | Final file |
|---|---|---|
| Filename | modeM0/AS1A05_069T04_9000002418cztM0_level2_bc.evt | modeM0/AS1A05_069T04_9000002418cztM0_level2_quad_clean.evt |
| Size (bytes) | 2,572,732,800 | 860,777,280 |
| Size | 2.4 GB | 820.9 MB |
| Events in quadrant A | 17,174,391 | 5,419,004 |
| Events in quadrant B | 19,500,075 | 5,521,436 |
| Events in quadrant C | 17,645,101 | 5,263,811 |
| Events in quadrant D | 18,857,066 | 5,098,990 |
| Mode M9 | |||
|---|---|---|---|
| Quadrant | BADHDUFLAG | Total packets | Discarded packets |
| A | 0 | 108 | 0 |
| B | 0 | 108 | 0 |
| C | 0 | 108 | 0 |
| D | 0 | 108 | 0 |
| Mode SS | |||
|---|---|---|---|
| Quadrant | BADHDUFLAG | Total packets | Discarded packets |
| A | 0 | 1416 | 0 |
| B | 0 | 1416 | 0 |
| C | 0 | 1416 | 0 |
| D | 0 | 1416 | 0 |
| Mode M0 | |||
|---|---|---|---|
| Quadrant | BADHDUFLAG | Total packets | Discarded packets |
| A | 0 | 155455 | 0 |
| B | 0 | 163064 | 0 |
| C | 0 | 157919 | 0 |
| D | 0 | 158577 | 0 |
| Quadrant | Total seconds | Saturated seconds | Saturation percentage |
|---|---|---|---|
| A | 69534 | 1844 | 2.651940% |
| B | 69534 | 1969 | 2.831708% |
| C | 69534 | 1718 | 2.470734% |
| D | 69534 | 1394 | 2.004775% |
Noise dominated data is calculated using 1-second bins in cleaned event files. If a bin has >2000 counts, and if more than 50% of those come from <1% of pixels, then it is considered to be noise-dominated and hence unusable.
| Quadrant | # 1 sec bins | Bins with >0 counts | Bins with >2000 counts | High rate bins dominated by noise | Noise dominated (total time) | Noise dominated (detector-on time) | Marked lightcurve |
|---|---|---|---|---|---|---|---|
| A | 80410 | 69530 | 53 | 53 | 0.07% | 0.08% |  |
| B | 80410 | 69532 | 104 | 104 | 0.13% | 0.15% | 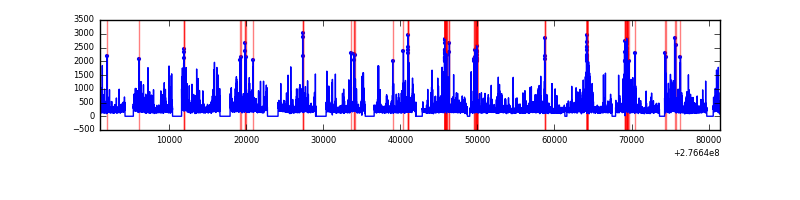 |
| C | 80410 | 69533 | 3 | 3 | 0.00% | 0.00% |  |
| D | 80410 | 69536 | 102 | 102 | 0.13% | 0.15% | 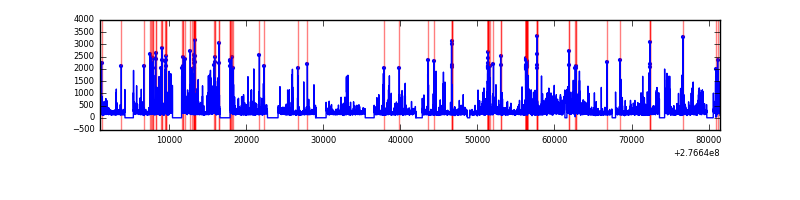 |
Top three noisy pixels from each quadrant. If the there are fewer than three noisy pixels in the level2.evt file, extra rows are filled as -1
| Pixel properties | Quadrant properties | ||||||
|---|---|---|---|---|---|---|---|
| Quadrant | DetID | PixID | Counts | Sigma | Mean | Median | Sigma |
| A | 15 | 174 | 2879324 | 3668.15 | 3631 | 3559 | 784.0 |
| A | 15 | 223 | 161772 | 201.81 | 3631 | 3559 | 784.0 |
| A | 9 | 143 | 87611 | 107.21 | 3631 | 3559 | 784.0 |
| B | 10 | 16 | 2006083 | 2899.78 | 3692 | 3602 | 690.6 |
| B | 15 | 35 | 690867 | 995.22 | 3692 | 3602 | 690.6 |
| B | 4 | 173 | 560984 | 807.14 | 3692 | 3602 | 690.6 |
| C | 3 | 233 | 4042836 | 4918.87 | 3510 | 3489 | 821.2 |
| C | 10 | 169 | 82008 | 95.62 | 3510 | 3489 | 821.2 |
| C | 7 | 247 | 25331 | 26.6 | 3510 | 3489 | 821.2 |
| D | 12 | 218 | 1651712 | 2013.45 | 3558 | 3428 | 818.6 |
| D | 1 | 52 | 1390810 | 1694.75 | 3558 | 3428 | 818.6 |
| D | 12 | 110 | 996663 | 1213.28 | 3558 | 3428 | 818.6 |
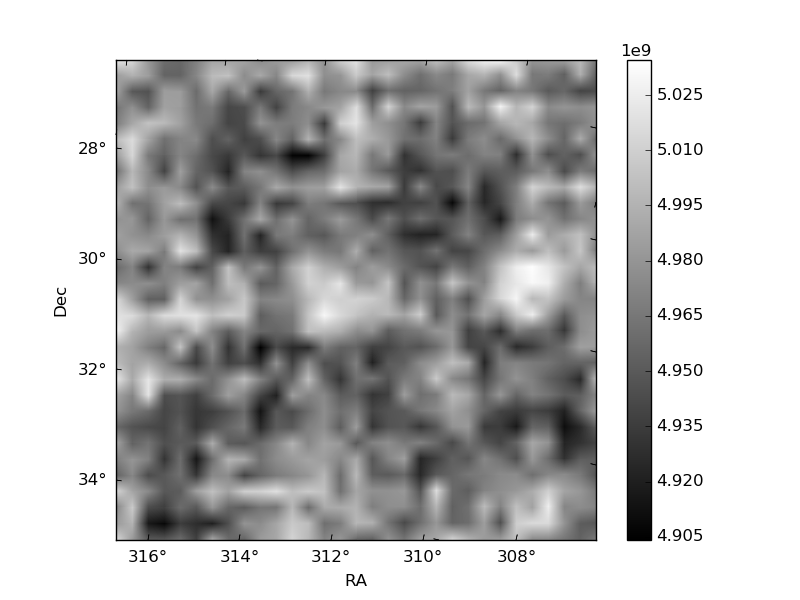
Histogram calculated using DETX and DETY for each event in the final _common_clean file
| Quadrant A |  |
 |
Quadrant B |
|---|---|---|---|
| Quadrant D |  |
 |
Quadrant C |
| Plot type | Count rate plots | Images |
|---|---|---|
| Comparison with Poisson distribution Blue bars denote a histogram of data divided into 1 sec bins. Red curve is a Poisson curve with rate = median count rate of data. |
 |
 |
| Quadrant-wise count rates Data is divided into 100 sec bins |
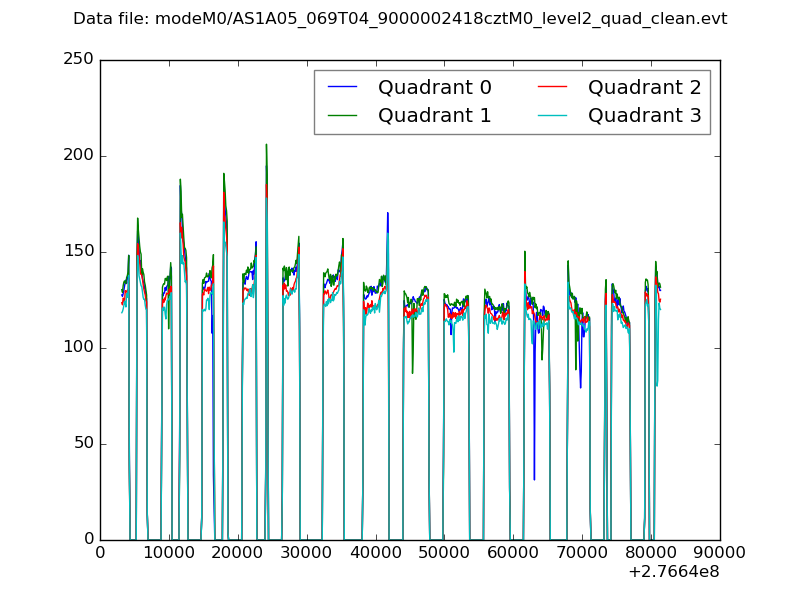 |
|
| Module-wise count rates for Quadrant A Data is divided into 100 sec bins |
 |
 |
| Module-wise count rates for Quadrant B Data is divided into 100 sec bins |
 |
 |
| Module-wise count rates for Quadrant C Data is divided into 100 sec bins |
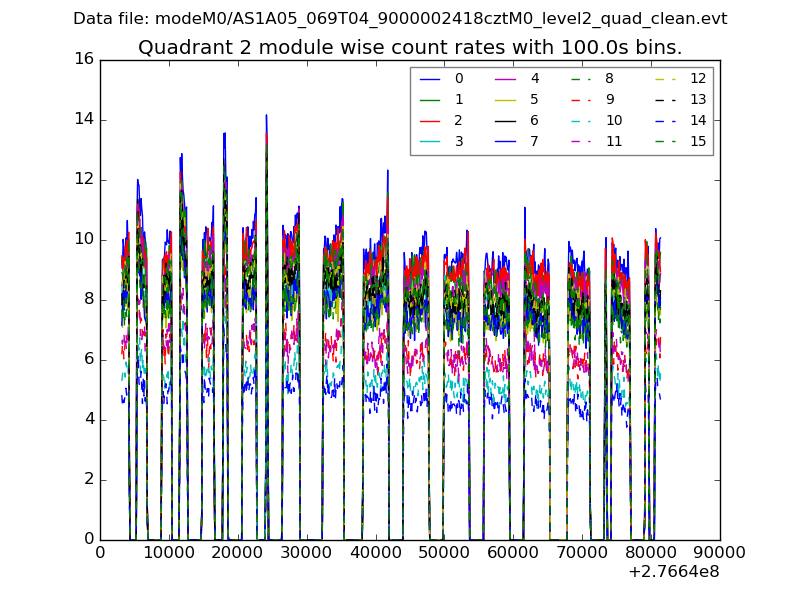 |
 |
| Module-wise count rates for Quadrant D Data is divided into 100 sec bins |
 |
 |
| Parameter | Plot |
|---|---|
| CZT HV Monitor |  |
| D_VDD |  |
| Temperature 1 |  |
| Veto HV Monitor |  |
| Veto LLD |  |
| Alpha Counter |  |
| _CPM_Rate |  |
| CZT Counter |  |
| +2.5 Volts monitor |  |
| +5 Volts monitor |  |
| _ROLL_ROT |  |
| _Roll_DEC |  |
| _Roll_RA |  |
| Veto Counter | 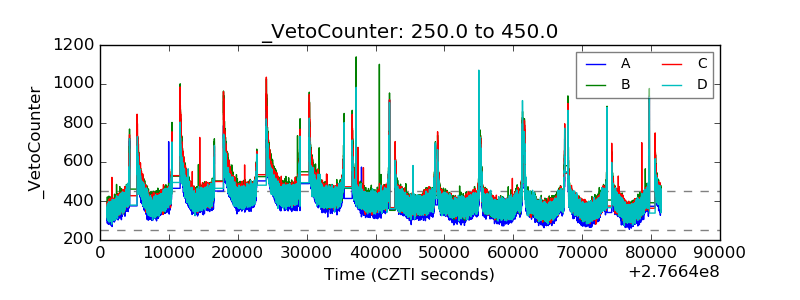 |