| Param | Original file | Final file |
|---|---|---|
| Filename | modeM0/AS1A05_069T03_9000002416cztM0_level2_bc.evt | modeM0/AS1A05_069T03_9000002416cztM0_level2_quad_clean.evt |
| Size (bytes) | 1,666,379,520 | 600,621,120 |
| Size | 1.6 GB | 572.8 MB |
| Events in quadrant A | 12,912,250 | 3,752,206 |
| Events in quadrant B | 11,503,298 | 3,884,034 |
| Events in quadrant C | 10,711,817 | 3,698,488 |
| Events in quadrant D | 12,108,470 | 3,608,957 |
| Mode M0 | |||
|---|---|---|---|
| Quadrant | BADHDUFLAG | Total packets | Discarded packets |
| A | 0 | 114027 | 0 |
| B | 0 | 104345 | 0 |
| C | 0 | 102353 | 0 |
| D | 0 | 107507 | 0 |
| Mode M9 | |||
|---|---|---|---|
| Quadrant | BADHDUFLAG | Total packets | Discarded packets |
| A | 0 | 58 | 0 |
| B | 0 | 58 | 0 |
| C | 0 | 58 | 0 |
| D | 0 | 58 | 0 |
| Mode SS | |||
|---|---|---|---|
| Quadrant | BADHDUFLAG | Total packets | Discarded packets |
| A | 0 | 968 | 0 |
| B | 0 | 968 | 0 |
| C | 0 | 968 | 0 |
| D | 0 | 968 | 0 |
| Quadrant | Total seconds | Saturated seconds | Saturation percentage |
|---|---|---|---|
| A | 47323 | 2689 | 5.682226% |
| B | 47323 | 1087 | 2.296980% |
| C | 47323 | 978 | 2.066648% |
| D | 47323 | 1344 | 2.840057% |
Noise dominated data is calculated using 1-second bins in cleaned event files. If a bin has >2000 counts, and if more than 50% of those come from <1% of pixels, then it is considered to be noise-dominated and hence unusable.
| Quadrant | # 1 sec bins | Bins with >0 counts | Bins with >2000 counts | High rate bins dominated by noise | Noise dominated (total time) | Noise dominated (detector-on time) | Marked lightcurve |
|---|---|---|---|---|---|---|---|
| A | 51878 | 47325 | 92 | 92 | 0.18% | 0.19% |  |
| B | 51878 | 47321 | 31 | 31 | 0.06% | 0.07% |  |
| C | 51878 | 47325 | 2 | 2 | 0.00% | 0.00% |  |
| D | 51878 | 47324 | 100 | 100 | 0.19% | 0.21% |  |
Top three noisy pixels from each quadrant. If the there are fewer than three noisy pixels in the level2.evt file, extra rows are filled as -1
| Pixel properties | Quadrant properties | ||||||
|---|---|---|---|---|---|---|---|
| Quadrant | DetID | PixID | Counts | Sigma | Mean | Median | Sigma |
| A | 15 | 174 | 3742844 | 7230.73 | 2369 | 2317 | 517.3 |
| A | 9 | 143 | 30027 | 53.57 | 2369 | 2317 | 517.3 |
| A | 15 | 223 | 27503 | 48.69 | 2369 | 2317 | 517.3 |
| B | 10 | 16 | 530712 | 1134.46 | 2442 | 2371 | 465.7 |
| B | 0 | 189 | 350587 | 747.7 | 2442 | 2371 | 465.7 |
| B | 15 | 35 | 345077 | 735.86 | 2442 | 2371 | 465.7 |
| C | 3 | 233 | 1651115 | 3004.26 | 2331 | 2315 | 548.8 |
| C | 10 | 169 | 73574 | 129.84 | 2331 | 2315 | 548.8 |
| C | 7 | 247 | 14715 | 22.59 | 2331 | 2315 | 548.8 |
| D | 10 | 70 | 1013509 | 1681.96 | 2353 | 2274 | 601.2 |
| D | 1 | 52 | 895298 | 1485.34 | 2353 | 2274 | 601.2 |
| D | 12 | 218 | 493409 | 816.89 | 2353 | 2274 | 601.2 |
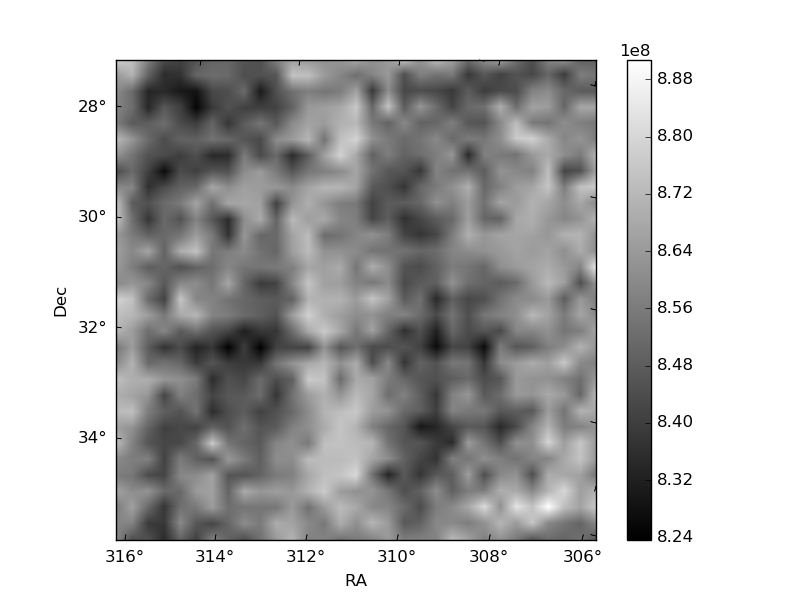
Histogram calculated using DETX and DETY for each event in the final _common_clean file
| Quadrant A |  |
 |
Quadrant B |
|---|---|---|---|
| Quadrant D |  |
 |
Quadrant C |
| Plot type | Count rate plots | Images |
|---|---|---|
| Comparison with Poisson distribution Blue bars denote a histogram of data divided into 1 sec bins. Red curve is a Poisson curve with rate = median count rate of data. |
 |
 |
| Quadrant-wise count rates Data is divided into 100 sec bins |
 |
|
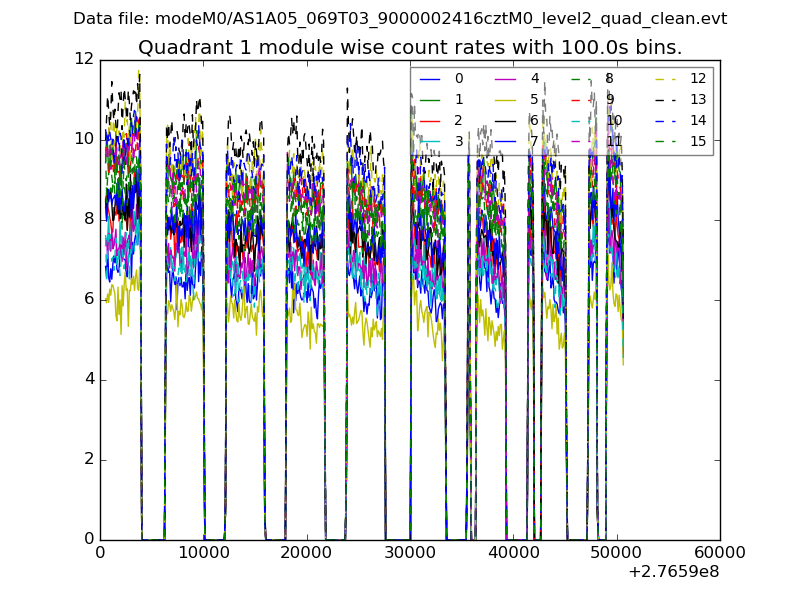
| Module-wise count rates for Quadrant A Data is divided into 100 sec bins |
 |
 |
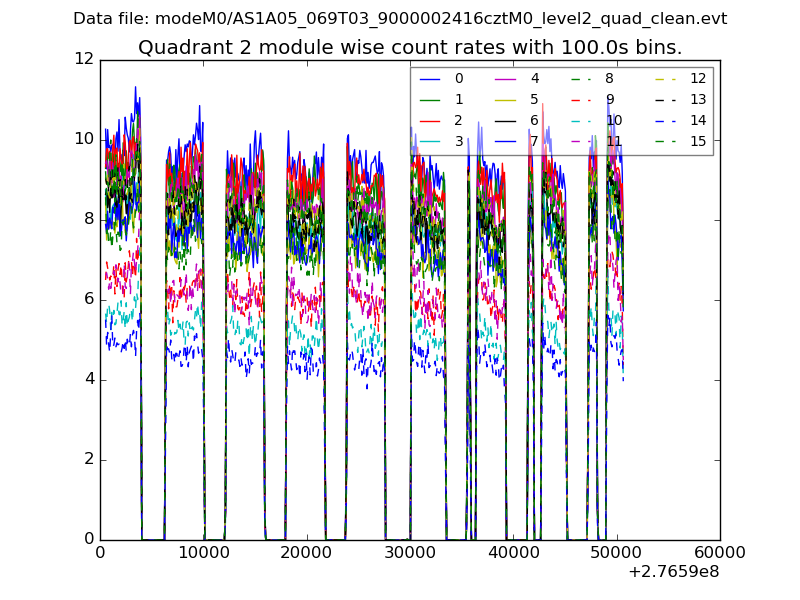
| Module-wise count rates for Quadrant B Data is divided into 100 sec bins |
 |
 |
| Module-wise count rates for Quadrant C Data is divided into 100 sec bins |
 |
 |
| Module-wise count rates for Quadrant D Data is divided into 100 sec bins |
 |
 |
| Parameter | Plot |
|---|---|
| CZT HV Monitor |  |
| D_VDD |  |
| Temperature 1 |  |
| Veto HV Monitor |  |
| Veto LLD |  |
| Alpha Counter | 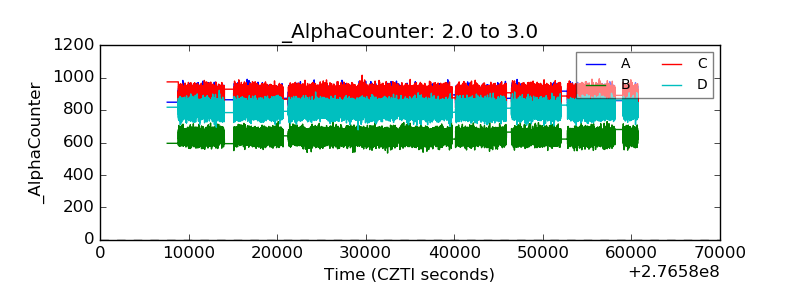 |
| _CPM_Rate |  |
| CZT Counter |  |
| +2.5 Volts monitor | 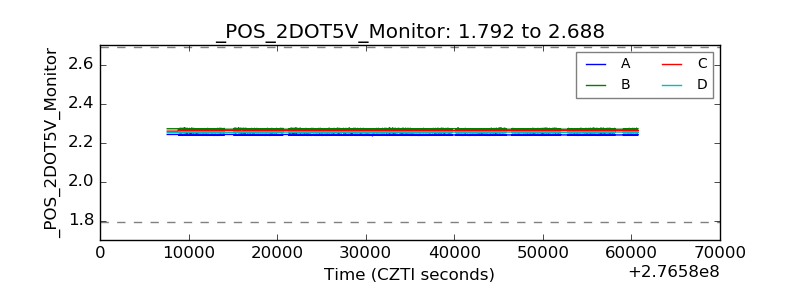 |
| +5 Volts monitor |  |
| _ROLL_ROT |  |
| _Roll_DEC |  |
| _Roll_RA |  |
| Veto Counter |  |