| Param | Original file | Final file |
|---|---|---|
| Filename | modeM0/AS1A05_069T02_9000002414cztM0_level2_bc.evt | modeM0/AS1A05_069T02_9000002414cztM0_level2_quad_clean.evt |
| Size (bytes) | 2,222,481,600 | 798,514,560 |
| Size | 2.1 GB | 761.5 MB |
| Events in quadrant A | 14,573,861 | 5,026,132 |
| Events in quadrant B | 16,130,559 | 5,115,811 |
| Events in quadrant C | 13,854,023 | 4,891,828 |
| Events in quadrant D | 18,346,715 | 4,724,234 |
| Mode M9 | |||
|---|---|---|---|
| Quadrant | BADHDUFLAG | Total packets | Discarded packets |
| A | 0 | 104 | 0 |
| B | 0 | 104 | 0 |
| C | 0 | 104 | 0 |
| D | 0 | 104 | 0 |
| Mode SS | |||
|---|---|---|---|
| Quadrant | BADHDUFLAG | Total packets | Discarded packets |
| A | 0 | 1316 | 0 |
| B | 0 | 1316 | 0 |
| C | 0 | 1316 | 0 |
| D | 0 | 1316 | 0 |
| Mode M0 | |||
|---|---|---|---|
| Quadrant | BADHDUFLAG | Total packets | Discarded packets |
| A | 0 | 139585 | 0 |
| B | 0 | 143632 | 0 |
| C | 0 | 136257 | 0 |
| D | 0 | 150401 | 0 |
| Quadrant | Total seconds | Saturated seconds | Saturation percentage |
|---|---|---|---|
| A | 64559 | 1491 | 2.309515% |
| B | 64559 | 1375 | 2.129835% |
| C | 64559 | 1140 | 1.765827% |
| D | 64559 | 1621 | 2.510882% |
Noise dominated data is calculated using 1-second bins in cleaned event files. If a bin has >2000 counts, and if more than 50% of those come from <1% of pixels, then it is considered to be noise-dominated and hence unusable.
| Quadrant | # 1 sec bins | Bins with >0 counts | Bins with >2000 counts | High rate bins dominated by noise | Noise dominated (total time) | Noise dominated (detector-on time) | Marked lightcurve |
|---|---|---|---|---|---|---|---|
| A | 75066 | 64558 | 34 | 34 | 0.05% | 0.05% |  |
| B | 75066 | 64559 | 46 | 46 | 0.06% | 0.07% |  |
| C | 75066 | 64563 | 39 | 39 | 0.05% | 0.06% | 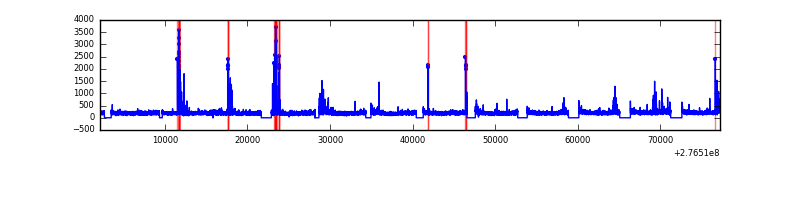 |
| D | 75066 | 64563 | 204 | 204 | 0.27% | 0.32% |  |
Top three noisy pixels from each quadrant. If the there are fewer than three noisy pixels in the level2.evt file, extra rows are filled as -1
| Pixel properties | Quadrant properties | ||||||
|---|---|---|---|---|---|---|---|
| Quadrant | DetID | PixID | Counts | Sigma | Mean | Median | Sigma |
| A | 15 | 174 | 1529874 | 2109.61 | 3373 | 3310 | 723.6 |
| A | 3 | 1 | 41665 | 53.0 | 3373 | 3310 | 723.6 |
| A | 15 | 223 | 37803 | 47.67 | 3373 | 3310 | 723.6 |
| B | 3 | 112 | 564469 | 870.11 | 3435 | 3341 | 644.9 |
| B | 0 | 189 | 473236 | 728.64 | 3435 | 3341 | 644.9 |
| B | 15 | 35 | 399863 | 614.86 | 3435 | 3341 | 644.9 |
| C | 0 | 207 | 564412 | 728.15 | 3291 | 3273 | 770.6 |
| C | 3 | 233 | 513979 | 662.71 | 3291 | 3273 | 770.6 |
| C | 7 | 247 | 77370 | 96.15 | 3291 | 3273 | 770.6 |
| D | 12 | 218 | 3009502 | 3934.15 | 3316 | 3202 | 764.2 |
| D | 1 | 52 | 1313592 | 1714.82 | 3316 | 3202 | 764.2 |
| D | 12 | 110 | 487953 | 634.36 | 3316 | 3202 | 764.2 |
Histogram calculated using DETX and DETY for each event in the final _common_clean file
| Quadrant A | 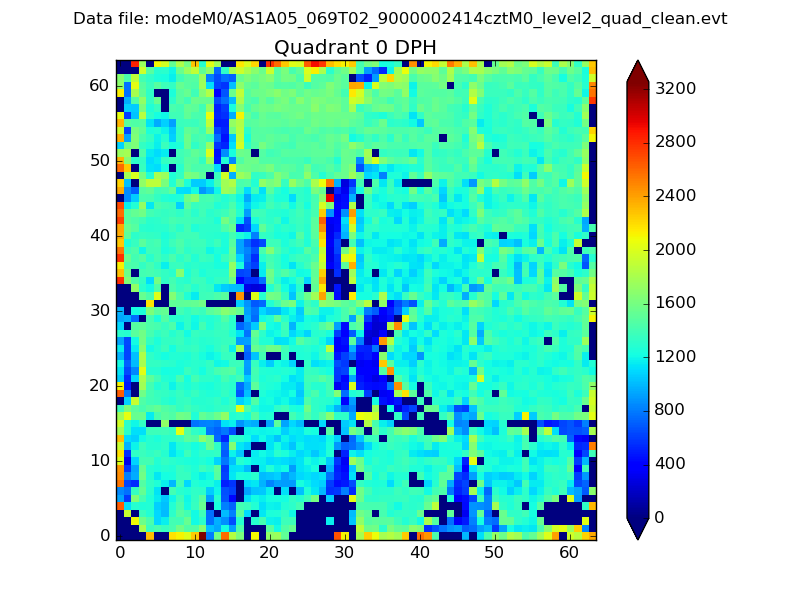 |
 |
Quadrant B |
|---|---|---|---|
| Quadrant D | 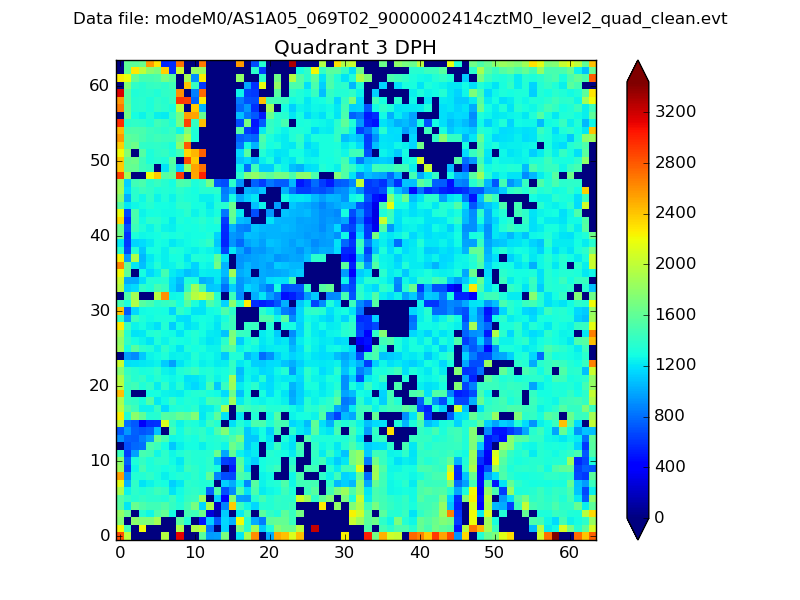 |
 |
Quadrant C |
| Plot type | Count rate plots | Images |
|---|---|---|
| Comparison with Poisson distribution Blue bars denote a histogram of data divided into 1 sec bins. Red curve is a Poisson curve with rate = median count rate of data. |
 |
 |
| Quadrant-wise count rates Data is divided into 100 sec bins |
 |
|
| Module-wise count rates for Quadrant A Data is divided into 100 sec bins |
 |
 |
| Module-wise count rates for Quadrant B Data is divided into 100 sec bins |
 |
 |
| Module-wise count rates for Quadrant C Data is divided into 100 sec bins |
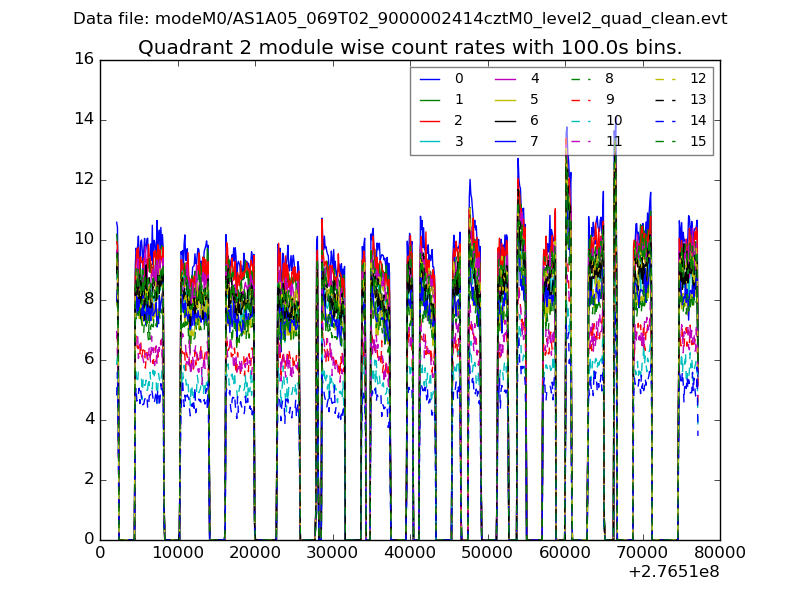 |
 |
| Module-wise count rates for Quadrant D Data is divided into 100 sec bins |
 |
 |
| Parameter | Plot |
|---|---|
| CZT HV Monitor |  |
| D_VDD |  |
| Temperature 1 |  |
| Veto HV Monitor |  |
| Veto LLD |  |
| Alpha Counter |  |
| _CPM_Rate |  |
| CZT Counter |  |
| +2.5 Volts monitor |  |
| +5 Volts monitor |  |
| _ROLL_ROT |  |
| _Roll_DEC |  |
| _Roll_RA |  |
| Veto Counter |  |