| Param | Original file | Final file |
|---|---|---|
| Filename | modeM0/AS1C04_007T01_9000002408cztM0_level2_bc.evt | modeM0/AS1C04_007T01_9000002408cztM0_level2_quad_clean.evt |
| Size (bytes) | 987,546,240 | 266,636,160 |
| Size | 941.8 MB | 254.3 MB |
| Events in quadrant A | 4,953,279 | 1,788,253 |
| Events in quadrant B | 14,307,747 | 1,376,767 |
| Events in quadrant C | 4,253,653 | 1,744,208 |
| Events in quadrant D | 4,952,233 | 1,718,074 |
| Mode SS | |||
|---|---|---|---|
| Quadrant | BADHDUFLAG | Total packets | Discarded packets |
| A | 0 | 430 | 0 |
| B | 0 | 430 | 0 |
| C | 0 | 430 | 0 |
| D | 0 | 430 | 0 |
| Mode M0 | |||
|---|---|---|---|
| Quadrant | BADHDUFLAG | Total packets | Discarded packets |
| A | 0 | 45890 | 0 |
| B | 0 | 96016 | 0 |
| C | 0 | 43684 | 0 |
| D | 0 | 45725 | 0 |
| Mode M9 | |||
|---|---|---|---|
| Quadrant | BADHDUFLAG | Total packets | Discarded packets |
| A | 0 | 12 | 0 |
| B | 0 | 12 | 0 |
| C | 0 | 12 | 0 |
| D | 0 | 12 | 0 |
| Quadrant | Total seconds | Saturated seconds | Saturation percentage |
|---|---|---|---|
| A | 20997 | 612 | 2.914702% |
| B | 20997 | 8655 | 41.220174% |
| C | 20997 | 617 | 2.938515% |
| D | 20997 | 579 | 2.757537% |
Noise dominated data is calculated using 1-second bins in cleaned event files. If a bin has >2000 counts, and if more than 50% of those come from <1% of pixels, then it is considered to be noise-dominated and hence unusable.
| Quadrant | # 1 sec bins | Bins with >0 counts | Bins with >2000 counts | High rate bins dominated by noise | Noise dominated (total time) | Noise dominated (detector-on time) | Marked lightcurve |
|---|---|---|---|---|---|---|---|
| A | 22343 | 21000 | 32 | 32 | 0.14% | 0.15% |  |
| B | 22343 | 20955 | 458 | 458 | 2.05% | 2.19% |  |
| C | 22343 | 20998 | 0 | 0 | 0.00% | 0.00% |  |
| D | 22343 | 20998 | 8 | 8 | 0.04% | 0.04% |  |
Top three noisy pixels from each quadrant. If the there are fewer than three noisy pixels in the level2.evt file, extra rows are filled as -1
| Pixel properties | Quadrant properties | ||||||
|---|---|---|---|---|---|---|---|
| Quadrant | DetID | PixID | Counts | Sigma | Mean | Median | Sigma |
| A | 15 | 174 | 611018 | 2410.54 | 1121 | 1097 | 253.0 |
| A | 15 | 239 | 33735 | 128.99 | 1121 | 1097 | 253.0 |
| A | 12 | 194 | 7476 | 25.21 | 1121 | 1097 | 253.0 |
| B | 3 | 112 | 10097535 | 59146.65 | 857 | 840 | 170.7 |
| B | 4 | 173 | 280477 | 1638.12 | 857 | 840 | 170.7 |
| B | 5 | 65 | 263969 | 1541.41 | 857 | 840 | 170.7 |
| C | 3 | 233 | 34217 | 128.77 | 1085 | 1082 | 257.3 |
| C | 0 | 207 | 24896 | 92.55 | 1085 | 1082 | 257.3 |
| C | 8 | 128 | 11818 | 41.72 | 1085 | 1082 | 257.3 |
| D | 10 | 70 | 270946 | 1010.52 | 1110 | 1068 | 267.1 |
| D | 12 | 110 | 101010 | 374.22 | 1110 | 1068 | 267.1 |
| D | 2 | 234 | 86730 | 320.75 | 1110 | 1068 | 267.1 |
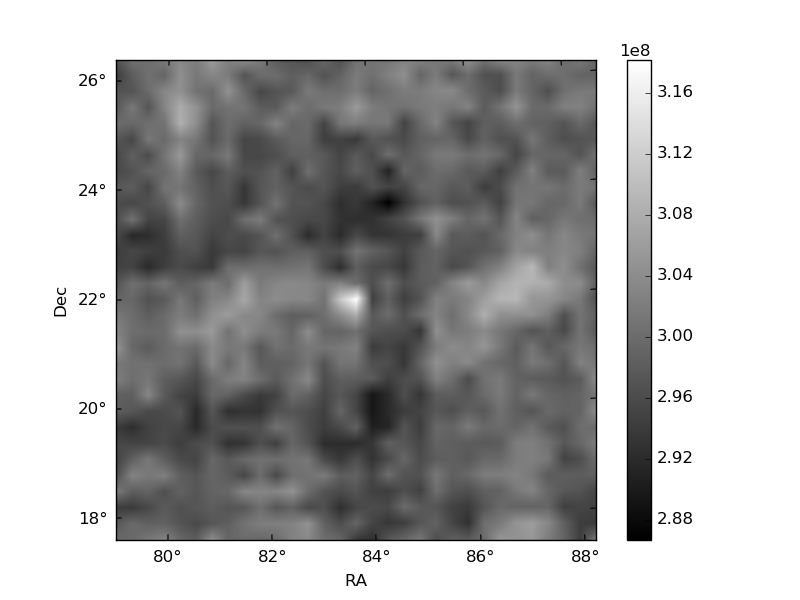
Histogram calculated using DETX and DETY for each event in the final _common_clean file
| Quadrant A | 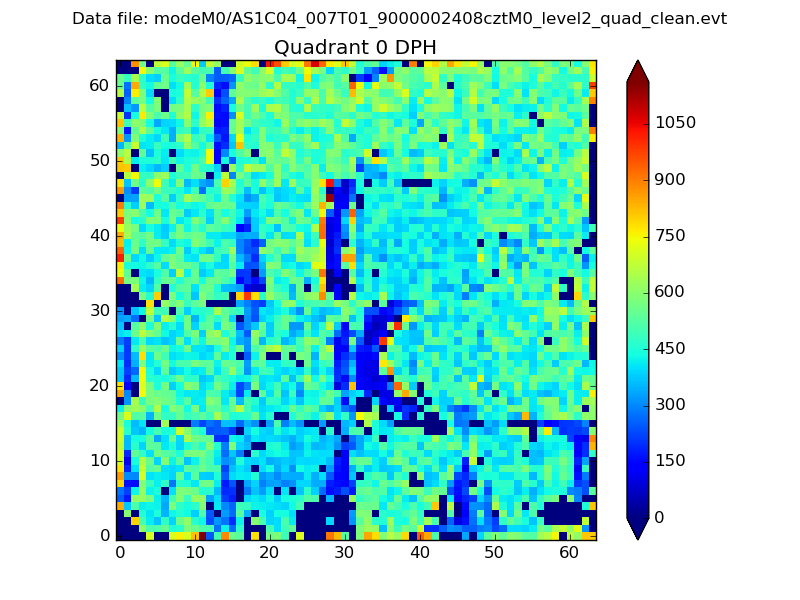 |
 |
Quadrant B |
|---|---|---|---|
| Quadrant D | 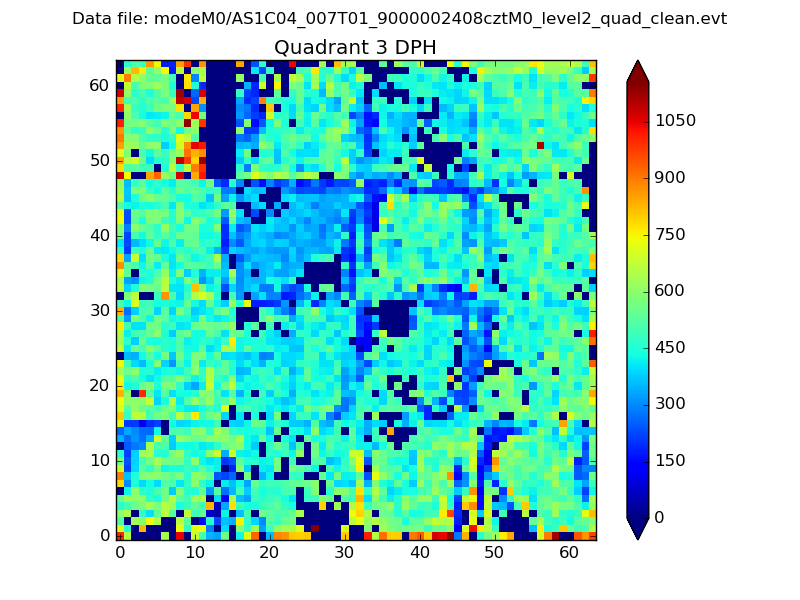 |
 |
Quadrant C |
| Plot type | Count rate plots | Images |
|---|---|---|
| Comparison with Poisson distribution Blue bars denote a histogram of data divided into 1 sec bins. Red curve is a Poisson curve with rate = median count rate of data. |
 |
 |
| Quadrant-wise count rates Data is divided into 100 sec bins |
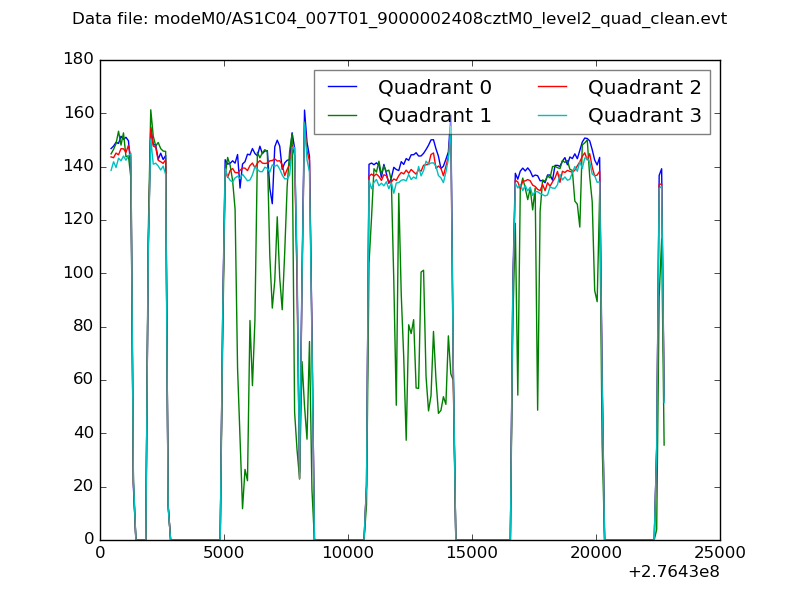 |
|
| Module-wise count rates for Quadrant A Data is divided into 100 sec bins |
 |
 |
| Module-wise count rates for Quadrant B Data is divided into 100 sec bins |
 |
 |
| Module-wise count rates for Quadrant C Data is divided into 100 sec bins |
 |
 |
| Module-wise count rates for Quadrant D Data is divided into 100 sec bins |
 |
 |
| Parameter | Plot |
|---|---|
| CZT HV Monitor |  |
| D_VDD |  |
| Temperature 1 |  |
| Veto HV Monitor |  |
| Veto LLD |  |
| Alpha Counter |  |
| _CPM_Rate |  |
| CZT Counter |  |
| +2.5 Volts monitor |  |
| +5 Volts monitor |  |
| _ROLL_ROT | 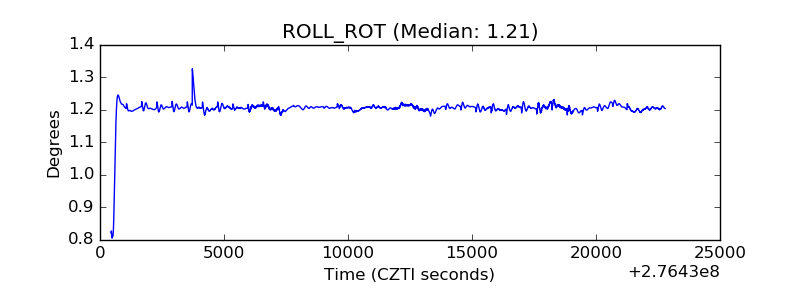 |
| _Roll_DEC |  |
| _Roll_RA |  |
| Veto Counter |  |