| Param | Original file | Final file |
|---|---|---|
| Filename | modeM0/AS1A05_149T04_9000002410cztM0_level2.evt | modeM0/AS1A05_149T04_9000002410cztM0_level2_quad_clean.evt |
| Size (bytes) | 1,283,650,560 | 164,355,840 |
| Size | 1.2 GB | 156.7 MB |
| Events in quadrant A | 9,656,951 | 1,001,622 |
| Events in quadrant B | 14,167,639 | 940,503 |
| Events in quadrant C | 6,939,519 | 1,037,522 |
| Events in quadrant D | 7,146,587 | 1,009,969 |
| Mode SS | |||
|---|---|---|---|
| Quadrant | BADHDUFLAG | Total packets | Discarded packets |
| A | 0 | 292 | 0 |
| B | 0 | 292 | 0 |
| C | 0 | 292 | 0 |
| D | 0 | 292 | 0 |
| Mode M9 | |||
|---|---|---|---|
| Quadrant | BADHDUFLAG | Total packets | Discarded packets |
| A | 0 | 23 | 0 |
| B | 0 | 23 | 0 |
| C | 0 | 23 | 0 |
| D | 0 | 23 | 0 |
| Mode M0 | |||
|---|---|---|---|
| Quadrant | BADHDUFLAG | Total packets | Discarded packets |
| A | 0 | 38468 | 0 |
| B | 0 | 51874 | 0 |
| C | 0 | 29990 | 0 |
| D | 0 | 31456 | 0 |
| Quadrant | Total seconds | Saturated seconds | Saturation percentage |
|---|---|---|---|
| A | 14288 | 1190 | 8.328667% |
| B | 14288 | 2938 | 20.562710% |
| C | 14288 | 161 | 1.126820% |
| D | 14288 | 144 | 1.007839% |
Noise dominated data is calculated using 1-second bins in cleaned event files. If a bin has >2000 counts, and if more than 50% of those come from <1% of pixels, then it is considered to be noise-dominated and hence unusable.
| Quadrant | # 1 sec bins | Bins with >0 counts | Bins with >2000 counts | High rate bins dominated by noise | Noise dominated (total time) | Noise dominated (detector-on time) | Marked lightcurve |
|---|---|---|---|---|---|---|---|
| A | 16584 | 14292 | 958 | 958 | 5.78% | 6.70% |  |
| B | 16584 | 14292 | 1929 | 1929 | 11.63% | 13.50% |  |
| C | 16584 | 14292 | 3 | 3 | 0.02% | 0.02% |  |
| D | 16584 | 14292 | 64 | 64 | 0.39% | 0.45% |  |
Top three noisy pixels from each quadrant. If the there are fewer than three noisy pixels in the level2.evt file, extra rows are filled as -1
| Pixel properties | Quadrant properties | ||||||
|---|---|---|---|---|---|---|---|
| Quadrant | DetID | PixID | Counts | Sigma | Mean | Median | Sigma |
| A | 15 | 174 | 3325834 | 10062.28 | 1644 | 1609 | 330.4 |
| A | 0 | 226 | 14498 | 39.01 | 1644 | 1609 | 330.4 |
| A | 12 | 194 | 11999 | 31.45 | 1644 | 1609 | 330.4 |
| B | 3 | 112 | 7033886 | 24232.21 | 1539 | 1503 | 290.2 |
| B | 10 | 247 | 250594 | 858.32 | 1539 | 1503 | 290.2 |
| B | 10 | 16 | 199130 | 680.98 | 1539 | 1503 | 290.2 |
| C | 3 | 233 | 313996 | 819.29 | 1630 | 1639 | 381.3 |
| C | 14 | 238 | 249592 | 650.36 | 1630 | 1639 | 381.3 |
| C | 0 | 207 | 24918 | 61.06 | 1630 | 1639 | 381.3 |
| D | 12 | 218 | 471307 | 1175.25 | 1645 | 1597 | 399.7 |
| D | 12 | 110 | 187648 | 465.51 | 1645 | 1597 | 399.7 |
| D | 10 | 70 | 155681 | 385.53 | 1645 | 1597 | 399.7 |
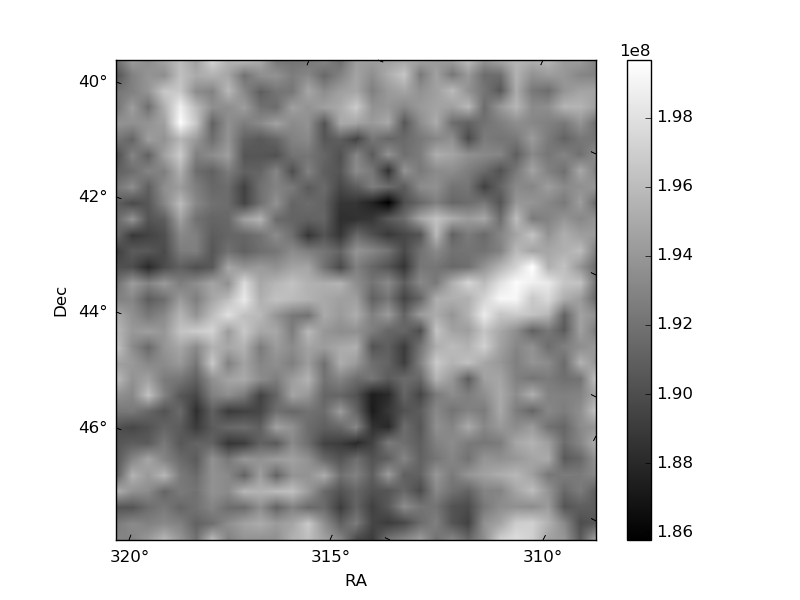
Histogram calculated using DETX and DETY for each event in the final _common_clean file
| Quadrant A |  |
 |
Quadrant B |
|---|---|---|---|
| Quadrant D |  |
 |
Quadrant C |
| Plot type | Count rate plots | Images |
|---|---|---|
| Comparison with Poisson distribution Blue bars denote a histogram of data divided into 1 sec bins. Red curve is a Poisson curve with rate = median count rate of data. |
 |
 |
| Quadrant-wise count rates Data is divided into 100 sec bins |
 |
|
| Module-wise count rates for Quadrant A Data is divided into 100 sec bins |
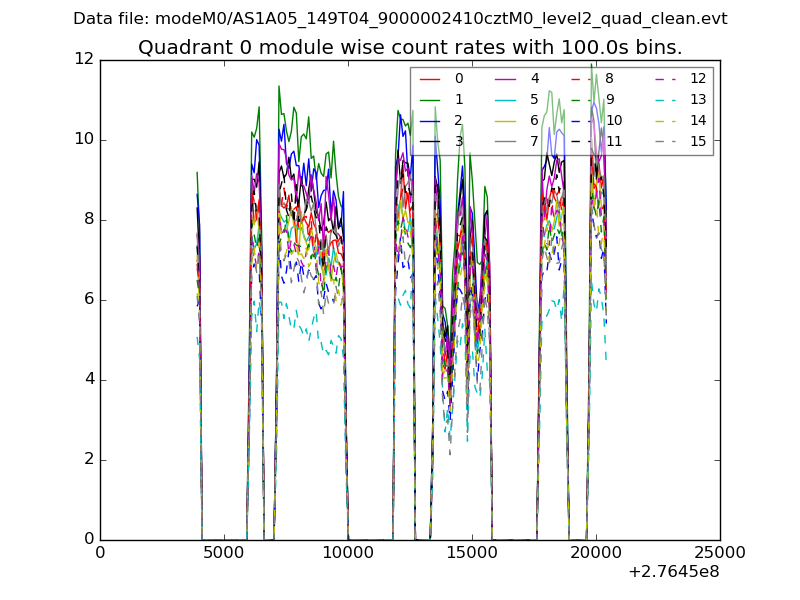 |
 |
| Module-wise count rates for Quadrant B Data is divided into 100 sec bins |
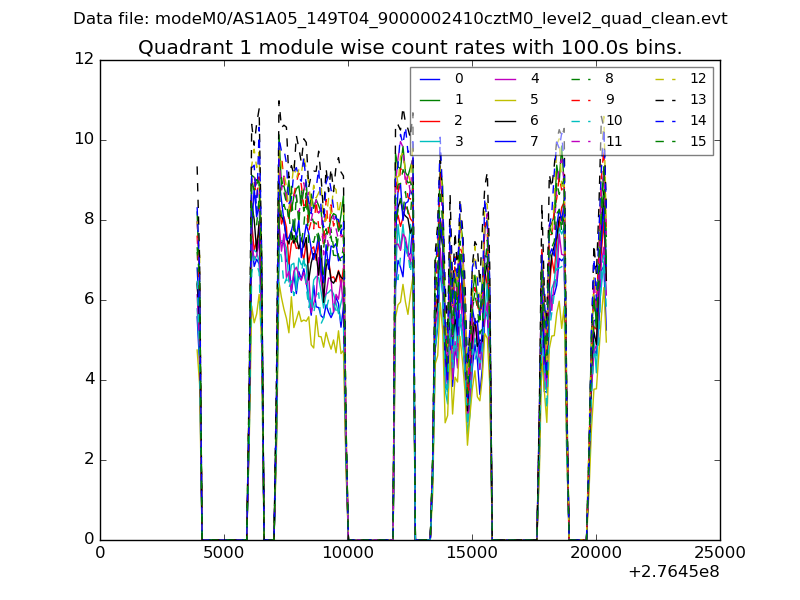 |
 |
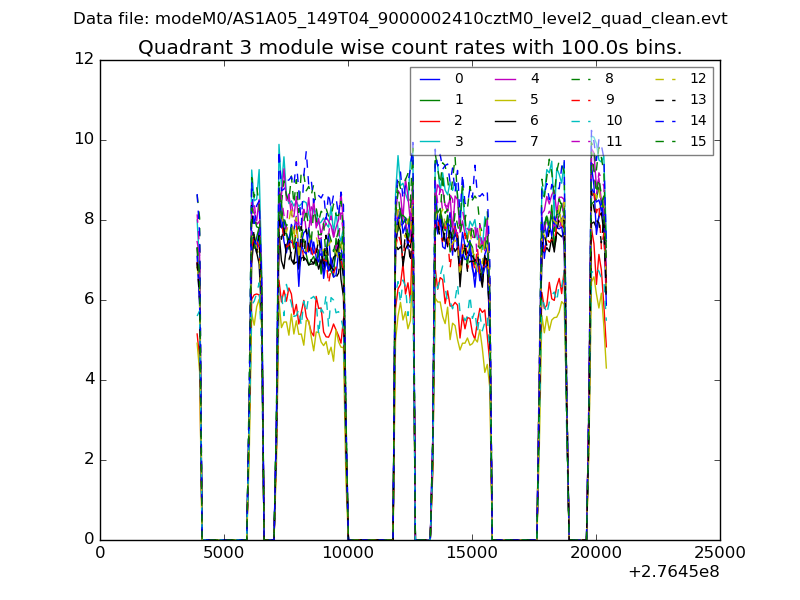
| Module-wise count rates for Quadrant C Data is divided into 100 sec bins |
 |
 |
| Module-wise count rates for Quadrant D Data is divided into 100 sec bins |
 |
 |
| Parameter | Plot |
|---|---|
| CZT HV Monitor |  |
| D_VDD |  |
| Temperature 1 |  |
| Veto HV Monitor | 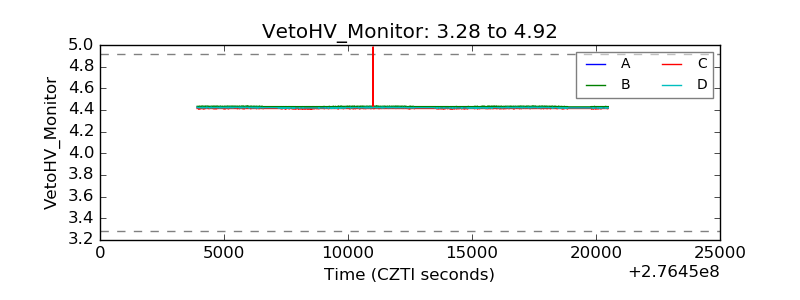 |
| Veto LLD |  |
| Alpha Counter |  |
| _CPM_Rate | 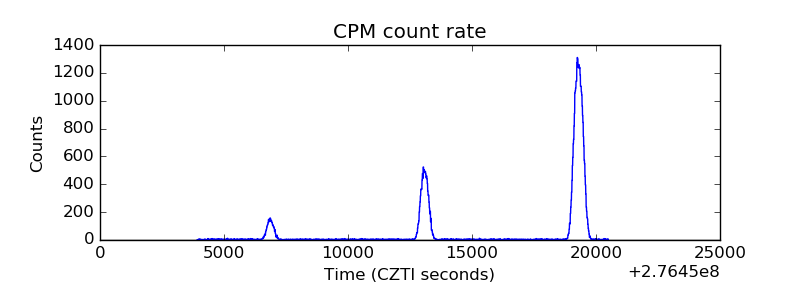 |
| CZT Counter |  |
| +2.5 Volts monitor |  |
| +5 Volts monitor |  |
| _ROLL_ROT |  |
| _Roll_DEC |  |
| _Roll_RA |  |
| Veto Counter |  |