| Param | Original file | Final file |
|---|---|---|
| Filename | modeM0/AS1A05_101T01_9000002412cztM0_level2_bc.evt | modeM0/AS1A05_101T01_9000002412cztM0_level2_quad_clean.evt |
| Size (bytes) | 1,265,722,560 | 417,752,640 |
| Size | 1.2 GB | 398.4 MB |
| Events in quadrant A | 7,589,582 | 2,603,188 |
| Events in quadrant B | 12,589,514 | 2,597,424 |
| Events in quadrant C | 7,110,743 | 2,666,422 |
| Events in quadrant D | 8,852,215 | 2,580,648 |
| Mode M0 | |||
|---|---|---|---|
| Quadrant | BADHDUFLAG | Total packets | Discarded packets |
| A | 0 | 68639 | 0 |
| B | 0 | 88662 | 0 |
| C | 0 | 67619 | 0 |
| D | 0 | 72192 | 0 |
| Mode M9 | |||
|---|---|---|---|
| Quadrant | BADHDUFLAG | Total packets | Discarded packets |
| A | 0 | 75 | 0 |
| B | 0 | 75 | 0 |
| C | 0 | 75 | 0 |
| D | 0 | 75 | 0 |
| Mode SS | |||
|---|---|---|---|
| Quadrant | BADHDUFLAG | Total packets | Discarded packets |
| A | 0 | 656 | 0 |
| B | 0 | 656 | 0 |
| C | 0 | 656 | 0 |
| D | 0 | 656 | 0 |
| Quadrant | Total seconds | Saturated seconds | Saturation percentage |
|---|---|---|---|
| A | 32082 | 504 | 1.570974% |
| B | 32082 | 1898 | 5.916090% |
| C | 32082 | 461 | 1.436943% |
| D | 32082 | 604 | 1.882676% |
Noise dominated data is calculated using 1-second bins in cleaned event files. If a bin has >2000 counts, and if more than 50% of those come from <1% of pixels, then it is considered to be noise-dominated and hence unusable.
| Quadrant | # 1 sec bins | Bins with >0 counts | Bins with >2000 counts | High rate bins dominated by noise | Noise dominated (total time) | Noise dominated (detector-on time) | Marked lightcurve |
|---|---|---|---|---|---|---|---|
| A | 39653 | 32084 | 1 | 1 | 0.00% | 0.00% |  |
| B | 39653 | 32081 | 190 | 190 | 0.48% | 0.59% |  |
| C | 39653 | 32082 | 0 | 0 | 0.00% | 0.00% |  |
| D | 39653 | 32084 | 102 | 102 | 0.26% | 0.32% |  |
Top three noisy pixels from each quadrant. If the there are fewer than three noisy pixels in the level2.evt file, extra rows are filled as -1
| Pixel properties | Quadrant properties | ||||||
|---|---|---|---|---|---|---|---|
| Quadrant | DetID | PixID | Counts | Sigma | Mean | Median | Sigma |
| A | 15 | 174 | 622093 | 1626.03 | 1804 | 1776 | 381.5 |
| A | 3 | 1 | 21608 | 51.98 | 1804 | 1776 | 381.5 |
| A | 9 | 143 | 14961 | 34.56 | 1804 | 1776 | 381.5 |
| B | 3 | 112 | 4425711 | 13343.0 | 1811 | 1774 | 331.6 |
| B | 4 | 173 | 262033 | 784.97 | 1811 | 1774 | 331.6 |
| B | 15 | 35 | 237748 | 711.72 | 1811 | 1774 | 331.6 |
| C | 3 | 233 | 180310 | 433.14 | 1802 | 1802 | 412.1 |
| C | 13 | 61 | 10535 | 21.19 | 1802 | 1802 | 412.1 |
| C | 0 | 207 | 9465 | 18.59 | 1802 | 1802 | 412.1 |
| D | 12 | 110 | 734510 | 1808.05 | 1814 | 1758 | 405.3 |
| D | 12 | 218 | 623416 | 1533.93 | 1814 | 1758 | 405.3 |
| D | 1 | 52 | 320921 | 787.53 | 1814 | 1758 | 405.3 |
Histogram calculated using DETX and DETY for each event in the final _common_clean file
| Quadrant A |  |
 |
Quadrant B |
|---|---|---|---|
| Quadrant D | 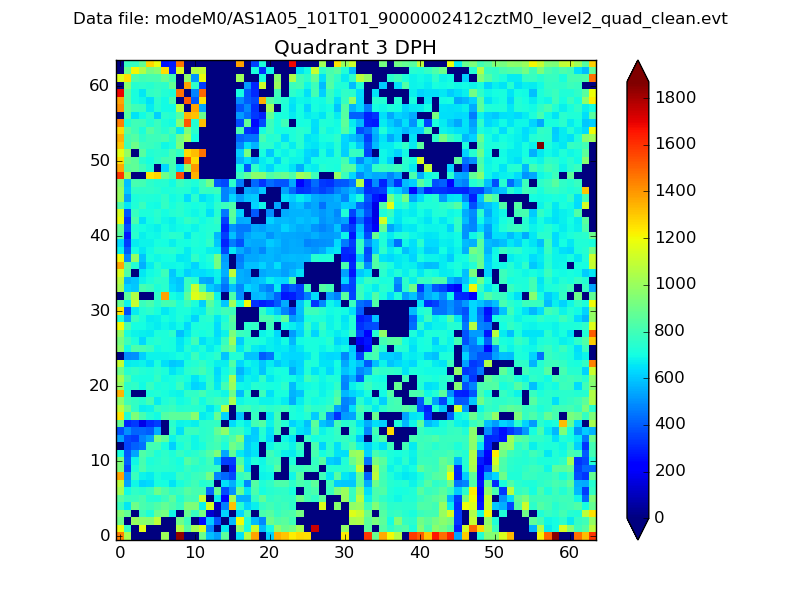 |
 |
Quadrant C |
| Plot type | Count rate plots | Images |
|---|---|---|
| Comparison with Poisson distribution Blue bars denote a histogram of data divided into 1 sec bins. Red curve is a Poisson curve with rate = median count rate of data. |
 |
 |
| Quadrant-wise count rates Data is divided into 100 sec bins |
 |
|
| Module-wise count rates for Quadrant A Data is divided into 100 sec bins |
 |
 |
| Module-wise count rates for Quadrant B Data is divided into 100 sec bins |
 |
 |
| Module-wise count rates for Quadrant C Data is divided into 100 sec bins |
 |
 |
| Module-wise count rates for Quadrant D Data is divided into 100 sec bins |
 |
 |
| Parameter | Plot |
|---|---|
| CZT HV Monitor |  |
| D_VDD |  |
| Temperature 1 |  |
| Veto HV Monitor |  |
| Veto LLD |  |
| Alpha Counter |  |
| _CPM_Rate | 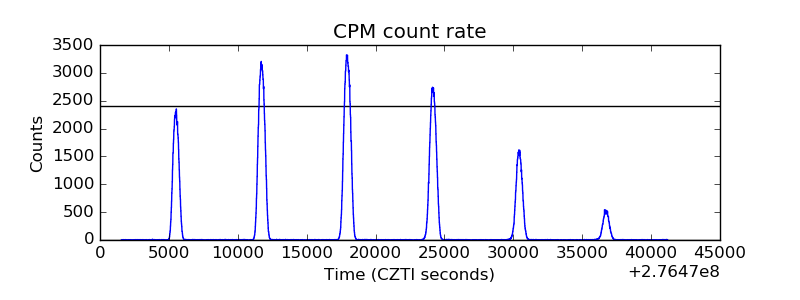 |
| CZT Counter |  |
| +2.5 Volts monitor |  |
| +5 Volts monitor |  |
| _ROLL_ROT | 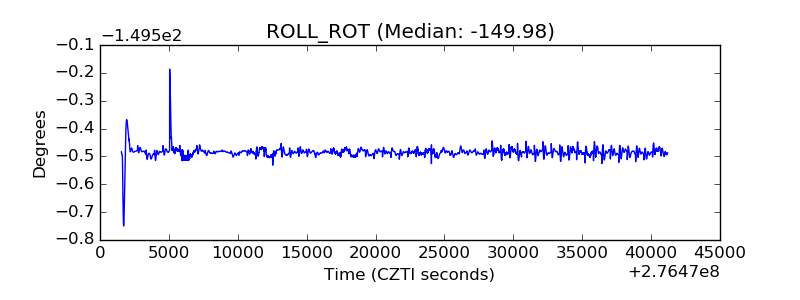 |
| _Roll_DEC |  |
| _Roll_RA | 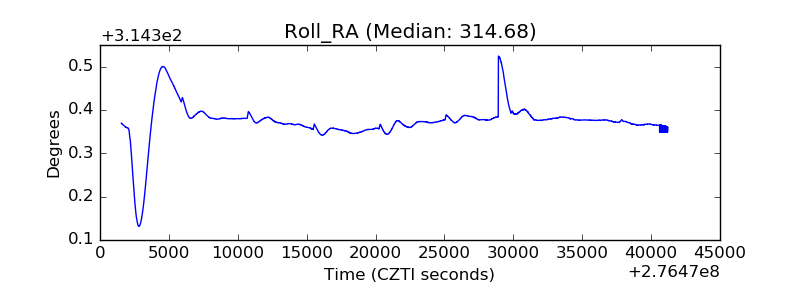 |
| Veto Counter |  |