| Param | Original file | Final file |
|---|---|---|
| Filename | modeM0/AS1A05_096T04_9000002406cztM0_level2_bc.evt | modeM0/AS1A05_096T04_9000002406cztM0_level2_quad_clean.evt |
| Size (bytes) | 2,712,775,680 | 1,165,829,760 |
| Size | 2.5 GB | 1.1 GB |
| Events in quadrant A | 16,961,421 | 7,610,214 |
| Events in quadrant B | 25,139,135 | 7,526,035 |
| Events in quadrant C | 15,893,493 | 7,600,758 |
| Events in quadrant D | 19,052,560 | 7,437,185 |
| Mode SS | |||
|---|---|---|---|
| Quadrant | BADHDUFLAG | Total packets | Discarded packets |
| A | 0 | 1524 | 0 |
| B | 0 | 1524 | 0 |
| C | 0 | 1524 | 0 |
| D | 0 | 1524 | 0 |
| Mode M0 | |||
|---|---|---|---|
| Quadrant | BADHDUFLAG | Total packets | Discarded packets |
| A | 0 | 161872 | 0 |
| B | 0 | 195692 | 0 |
| C | 0 | 156245 | 0 |
| D | 0 | 166628 | 0 |
| Mode M9 | |||
|---|---|---|---|
| Quadrant | BADHDUFLAG | Total packets | Discarded packets |
| A | 0 | 121 | 0 |
| B | 0 | 121 | 0 |
| C | 0 | 121 | 0 |
| D | 0 | 121 | 0 |
| Quadrant | Total seconds | Saturated seconds | Saturation percentage |
|---|---|---|---|
| A | 74952 | 1658 | 2.212082% |
| B | 74952 | 5106 | 6.812360% |
| C | 74952 | 1271 | 1.695752% |
| D | 74952 | 1473 | 1.965258% |
Noise dominated data is calculated using 1-second bins in cleaned event files. If a bin has >2000 counts, and if more than 50% of those come from <1% of pixels, then it is considered to be noise-dominated and hence unusable.
| Quadrant | # 1 sec bins | Bins with >0 counts | Bins with >2000 counts | High rate bins dominated by noise | Noise dominated (total time) | Noise dominated (detector-on time) | Marked lightcurve |
|---|---|---|---|---|---|---|---|
| A | 87003 | 74954 | 39 | 39 | 0.04% | 0.05% |  |
| B | 87003 | 74944 | 348 | 348 | 0.40% | 0.46% |  |
| C | 87003 | 74954 | 0 | 0 | 0.00% | 0.00% |  |
| D | 87003 | 74955 | 60 | 60 | 0.07% | 0.08% |  |
Top three noisy pixels from each quadrant. If the there are fewer than three noisy pixels in the level2.evt file, extra rows are filled as -1
| Pixel properties | Quadrant properties | ||||||
|---|---|---|---|---|---|---|---|
| Quadrant | DetID | PixID | Counts | Sigma | Mean | Median | Sigma |
| A | 15 | 174 | 1941588 | 2302.08 | 3895 | 3827 | 841.7 |
| A | 3 | 1 | 41951 | 45.29 | 3895 | 3827 | 841.7 |
| A | 0 | 226 | 25711 | 26.0 | 3895 | 3827 | 841.7 |
| B | 3 | 112 | 7932697 | 10973.97 | 3851 | 3760 | 722.5 |
| B | 0 | 189 | 429933 | 589.84 | 3851 | 3760 | 722.5 |
| B | 0 | 198 | 359453 | 492.29 | 3851 | 3760 | 722.5 |
| C | 3 | 233 | 759875 | 827.44 | 3882 | 3866 | 913.7 |
| C | 0 | 207 | 154992 | 165.41 | 3882 | 3866 | 913.7 |
| C | 7 | 247 | 48252 | 48.58 | 3882 | 3866 | 913.7 |
| D | 12 | 110 | 1035898 | 1134.3 | 3938 | 3805 | 909.9 |
| D | 2 | 14 | 963743 | 1055.0 | 3938 | 3805 | 909.9 |
| D | 1 | 52 | 517248 | 564.29 | 3938 | 3805 | 909.9 |
Histogram calculated using DETX and DETY for each event in the final _common_clean file
| Quadrant A |  |
 |
Quadrant B |
|---|---|---|---|
| Quadrant D |  |
 |
Quadrant C |
| Plot type | Count rate plots | Images |
|---|---|---|
| Comparison with Poisson distribution Blue bars denote a histogram of data divided into 1 sec bins. Red curve is a Poisson curve with rate = median count rate of data. |
 |
 |
| Quadrant-wise count rates Data is divided into 100 sec bins |
 |
|
| Module-wise count rates for Quadrant A Data is divided into 100 sec bins |
 |
 |
| Module-wise count rates for Quadrant B Data is divided into 100 sec bins |
 |
 |
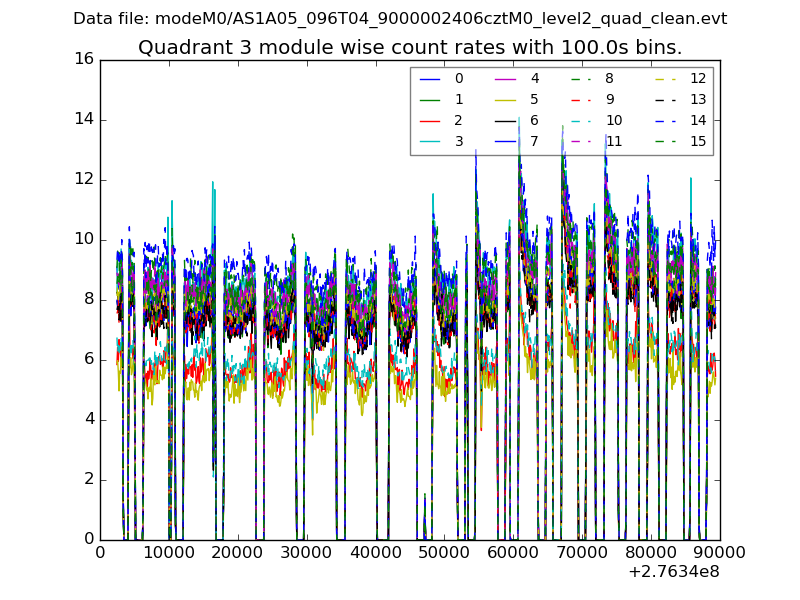
| Module-wise count rates for Quadrant C Data is divided into 100 sec bins |
 |
 |
| Module-wise count rates for Quadrant D Data is divided into 100 sec bins |
 |
 |
| Parameter | Plot |
|---|---|
| CZT HV Monitor |  |
| D_VDD |  |
| Temperature 1 |  |
| Veto HV Monitor |  |
| Veto LLD |  |
| Alpha Counter |  |
| _CPM_Rate |  |
| CZT Counter |  |
| +2.5 Volts monitor |  |
| +5 Volts monitor |  |
| _ROLL_ROT |  |
| _Roll_DEC |  |
| _Roll_RA |  |
| Veto Counter |  |