| Param | Original file | Final file |
|---|---|---|
| Filename | modeM0/AS1A05_034T01_9000002404cztM0_level2_bc.evt | modeM0/AS1A05_034T01_9000002404cztM0_level2_quad_clean.evt |
| Size (bytes) | 2,458,935,360 | 974,148,480 |
| Size | 2.3 GB | 929.0 MB |
| Events in quadrant A | 17,805,502 | 6,023,553 |
| Events in quadrant B | 18,155,391 | 6,219,316 |
| Events in quadrant C | 15,701,199 | 6,108,853 |
| Events in quadrant D | 17,711,386 | 6,031,265 |
| Mode M0 | |||
|---|---|---|---|
| Quadrant | BADHDUFLAG | Total packets | Discarded packets |
| A | 0 | 164423 | 0 |
| B | 0 | 163289 | 0 |
| C | 0 | 156347 | 0 |
| D | 0 | 160214 | 0 |
| Mode SS | |||
|---|---|---|---|
| Quadrant | BADHDUFLAG | Total packets | Discarded packets |
| A | 0 | 1522 | 0 |
| B | 0 | 1522 | 0 |
| C | 0 | 1522 | 0 |
| D | 0 | 1522 | 0 |
| Mode M9 | |||
|---|---|---|---|
| Quadrant | BADHDUFLAG | Total packets | Discarded packets |
| A | 0 | 129 | 0 |
| B | 0 | 129 | 0 |
| C | 0 | 129 | 0 |
| D | 0 | 129 | 0 |
| Quadrant | Total seconds | Saturated seconds | Saturation percentage |
|---|---|---|---|
| A | 74732 | 1749 | 2.340363% |
| B | 74732 | 1330 | 1.779693% |
| C | 74732 | 1327 | 1.775678% |
| D | 74732 | 1020 | 1.364877% |
Noise dominated data is calculated using 1-second bins in cleaned event files. If a bin has >2000 counts, and if more than 50% of those come from <1% of pixels, then it is considered to be noise-dominated and hence unusable.
| Quadrant | # 1 sec bins | Bins with >0 counts | Bins with >2000 counts | High rate bins dominated by noise | Noise dominated (total time) | Noise dominated (detector-on time) | Marked lightcurve |
|---|---|---|---|---|---|---|---|
| A | 91399 | 74738 | 10 | 10 | 0.01% | 0.01% |  |
| B | 91399 | 74735 | 23 | 23 | 0.03% | 0.03% |  |
| C | 91399 | 74735 | 0 | 0 | 0.00% | 0.00% |  |
| D | 91399 | 74738 | 42 | 42 | 0.05% | 0.06% |  |
Top three noisy pixels from each quadrant. If the there are fewer than three noisy pixels in the level2.evt file, extra rows are filled as -1
| Pixel properties | Quadrant properties | ||||||
|---|---|---|---|---|---|---|---|
| Quadrant | DetID | PixID | Counts | Sigma | Mean | Median | Sigma |
| A | 15 | 174 | 2403911 | 2802.64 | 4004 | 3931 | 856.3 |
| A | 12 | 194 | 26177 | 25.98 | 4004 | 3931 | 856.3 |
| A | 0 | 226 | 26092 | 25.88 | 4004 | 3931 | 856.3 |
| B | 4 | 173 | 532410 | 702.16 | 4096 | 4003 | 752.5 |
| B | 0 | 198 | 399744 | 525.87 | 4096 | 4003 | 752.5 |
| B | 0 | 189 | 338945 | 445.08 | 4096 | 4003 | 752.5 |
| C | 3 | 233 | 271210 | 293.01 | 3968 | 3967 | 912.1 |
| C | 0 | 207 | 108856 | 115.0 | 3968 | 3967 | 912.1 |
| C | 7 | 247 | 49373 | 49.78 | 3968 | 3967 | 912.1 |
| D | 1 | 52 | 796025 | 817.7 | 4014 | 3912 | 968.7 |
| D | 10 | 70 | 593616 | 608.75 | 4014 | 3912 | 968.7 |
| D | 2 | 122 | 336930 | 343.77 | 4014 | 3912 | 968.7 |
Histogram calculated using DETX and DETY for each event in the final _common_clean file
| Quadrant A | 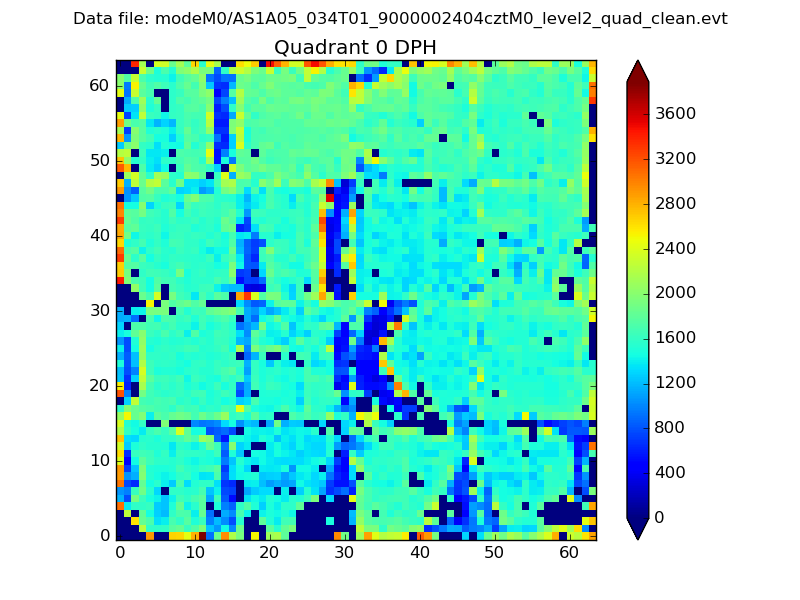 |
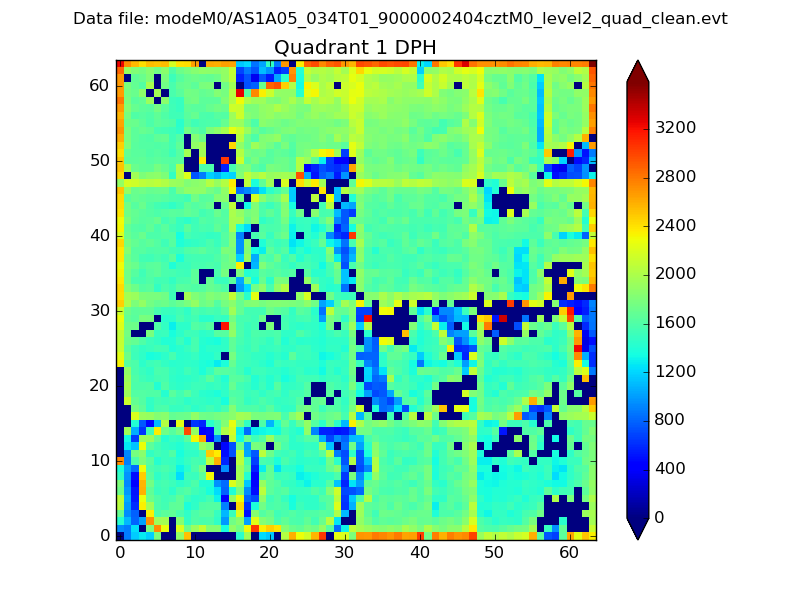 |
Quadrant B |
|---|---|---|---|
| Quadrant D |  |
 |
Quadrant C |
| Plot type | Count rate plots | Images |
|---|---|---|
| Comparison with Poisson distribution Blue bars denote a histogram of data divided into 1 sec bins. Red curve is a Poisson curve with rate = median count rate of data. |
 |
 |
| Quadrant-wise count rates Data is divided into 100 sec bins |
 |
|
| Module-wise count rates for Quadrant A Data is divided into 100 sec bins |
 |
 |
| Module-wise count rates for Quadrant B Data is divided into 100 sec bins |
 |
 |
| Module-wise count rates for Quadrant C Data is divided into 100 sec bins |
 |
 |
| Module-wise count rates for Quadrant D Data is divided into 100 sec bins |
 |
 |
| Parameter | Plot |
|---|---|
| CZT HV Monitor |  |
| D_VDD |  |
| Temperature 1 |  |
| Veto HV Monitor | 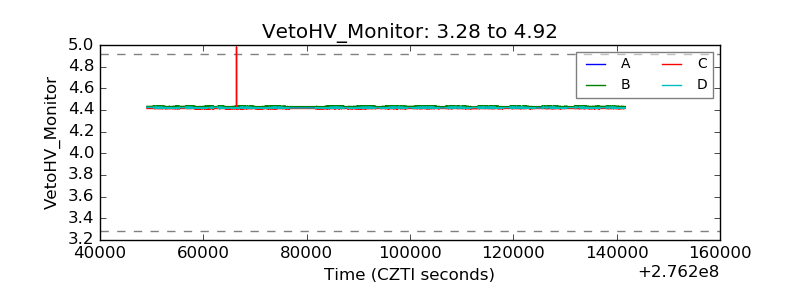 |
| Veto LLD | 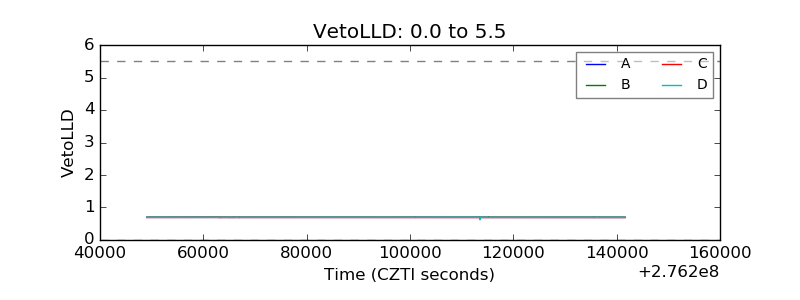 |
| Alpha Counter | 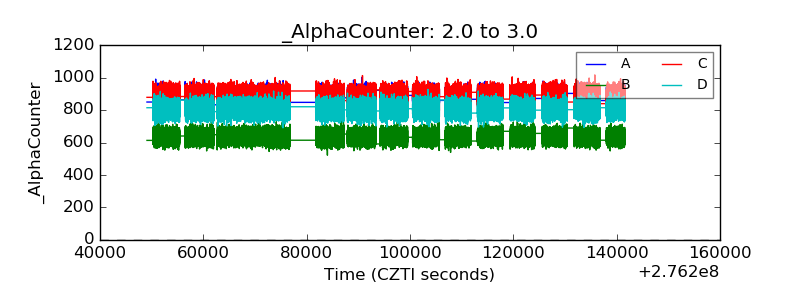 |
| _CPM_Rate |  |
| CZT Counter |  |
| +2.5 Volts monitor |  |
| +5 Volts monitor |  |
| _ROLL_ROT |  |
| _Roll_DEC |  |
| _Roll_RA |  |
| Veto Counter | 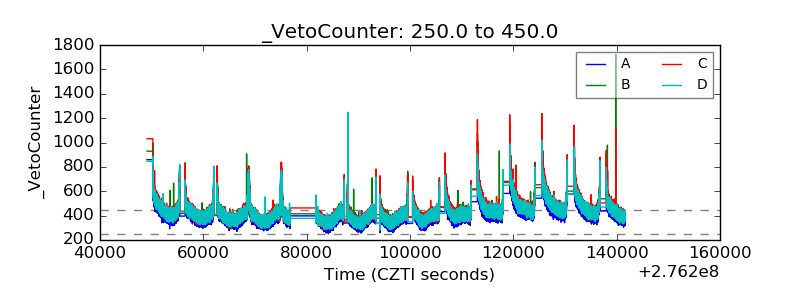 |