| Param | Original file | Final file |
|---|---|---|
| Filename | modeM0/AS1A05_212T09_9000002398cztM0_level2_bc.evt | modeM0/AS1A05_212T09_9000002398cztM0_level2_quad_clean.evt |
| Size (bytes) | 165,594,240 | 74,427,840 |
| Size | 157.9 MB | 71.0 MB |
| Events in quadrant A | 1,135,556 | 469,865 |
| Events in quadrant B | 1,152,986 | 475,826 |
| Events in quadrant C | 1,058,639 | 463,365 |
| Events in quadrant D | 1,282,406 | 457,507 |
| Mode M0 | |||
|---|---|---|---|
| Quadrant | BADHDUFLAG | Total packets | Discarded packets |
| A | 0 | 11453 | 0 |
| B | 0 | 11404 | 0 |
| C | 0 | 11279 | 0 |
| D | 0 | 11720 | 0 |
| Mode M9 | |||
|---|---|---|---|
| Quadrant | BADHDUFLAG | Total packets | Discarded packets |
| A | 0 | 1 | 0 |
| B | 0 | 1 | 0 |
| C | 0 | 1 | 0 |
| D | 0 | 1 | 0 |
| Mode SS | |||
|---|---|---|---|
| Quadrant | BADHDUFLAG | Total packets | Discarded packets |
| A | 0 | 110 | 0 |
| B | 0 | 110 | 0 |
| C | 0 | 110 | 0 |
| D | 0 | 110 | 0 |
| Quadrant | Total seconds | Saturated seconds | Saturation percentage |
|---|---|---|---|
| A | 5536 | 42 | 0.758671% |
| B | 5536 | 24 | 0.433526% |
| C | 5536 | 54 | 0.975434% |
| D | 5536 | 34 | 0.614162% |
Noise dominated data is calculated using 1-second bins in cleaned event files. If a bin has >2000 counts, and if more than 50% of those come from <1% of pixels, then it is considered to be noise-dominated and hence unusable.
| Quadrant | # 1 sec bins | Bins with >0 counts | Bins with >2000 counts | High rate bins dominated by noise | Noise dominated (total time) | Noise dominated (detector-on time) | Marked lightcurve |
|---|---|---|---|---|---|---|---|
| A | 5536 | 5536 | 2 | 2 | 0.04% | 0.04% | 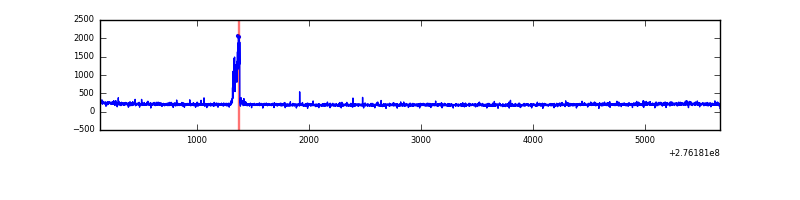 |
| B | 5536 | 5536 | 0 | 0 | 0.00% | 0.00% |  |
| C | 5536 | 5536 | 0 | 0 | 0.00% | 0.00% |  |
| D | 5536 | 5536 | 0 | 0 | 0.00% | 0.00% |  |
Top three noisy pixels from each quadrant. If the there are fewer than three noisy pixels in the level2.evt file, extra rows are filled as -1
| Pixel properties | Quadrant properties | ||||||
|---|---|---|---|---|---|---|---|
| Quadrant | DetID | PixID | Counts | Sigma | Mean | Median | Sigma |
| A | 15 | 239 | 70992 | 1128.18 | 277 | 271 | 62.7 |
| A | 0 | 226 | 1896 | 25.92 | 277 | 271 | 62.7 |
| A | 12 | 194 | 1800 | 24.39 | 277 | 271 | 62.7 |
| B | 0 | 189 | 36541 | 649.11 | 280 | 273 | 55.9 |
| B | 0 | 198 | 15470 | 271.99 | 280 | 273 | 55.9 |
| B | 3 | 64 | 9956 | 173.3 | 280 | 273 | 55.9 |
| C | 3 | 233 | 13243 | 198.04 | 270 | 268 | 65.5 |
| C | 0 | 207 | 4421 | 63.39 | 270 | 268 | 65.5 |
| C | 13 | 61 | 1510 | 18.96 | 270 | 268 | 65.5 |
| D | 1 | 52 | 106636 | 1604.96 | 276 | 266 | 66.3 |
| D | 10 | 70 | 87927 | 1322.67 | 276 | 266 | 66.3 |
| D | 2 | 234 | 21219 | 316.15 | 276 | 266 | 66.3 |
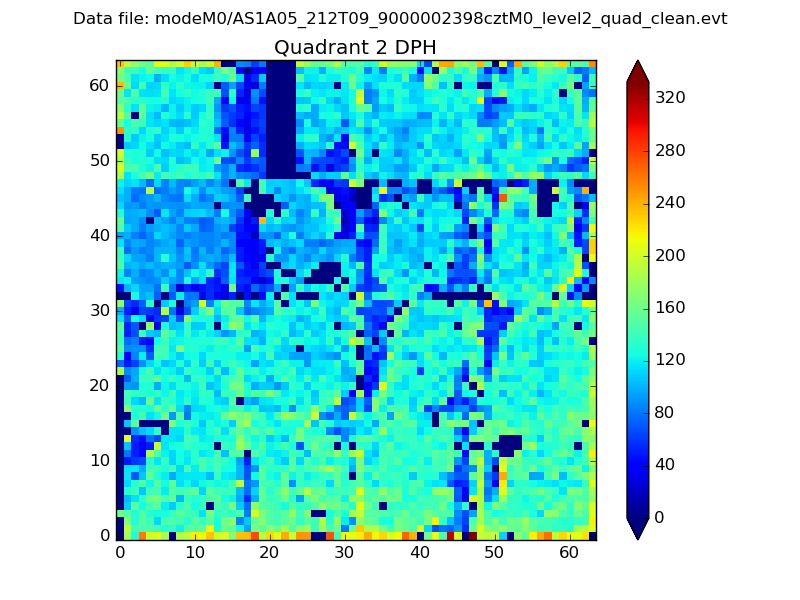
Histogram calculated using DETX and DETY for each event in the final _common_clean file
| Quadrant A |  |
 |
Quadrant B |
|---|---|---|---|
| Quadrant D |  |
 |
Quadrant C |
| Plot type | Count rate plots | Images |
|---|---|---|
| Comparison with Poisson distribution Blue bars denote a histogram of data divided into 1 sec bins. Red curve is a Poisson curve with rate = median count rate of data. |
 |
 |
| Quadrant-wise count rates Data is divided into 100 sec bins |
 |
|
| Module-wise count rates for Quadrant A Data is divided into 100 sec bins |
 |
 |
| Module-wise count rates for Quadrant B Data is divided into 100 sec bins |
 |
 |
| Module-wise count rates for Quadrant C Data is divided into 100 sec bins |
 |
 |
| Module-wise count rates for Quadrant D Data is divided into 100 sec bins |
 |
 |
| Parameter | Plot |
|---|---|
| CZT HV Monitor |  |
| D_VDD |  |
| Temperature 1 |  |
| Veto HV Monitor |  |
| Veto LLD |  |
| Alpha Counter |  |
| _CPM_Rate |  |
| CZT Counter |  |
| +2.5 Volts monitor |  |
| +5 Volts monitor |  |
| _ROLL_ROT | 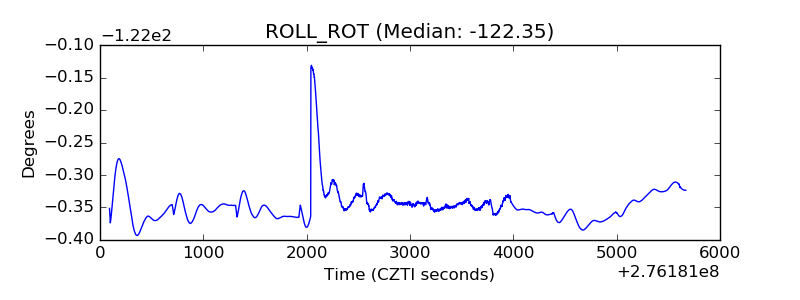 |
| _Roll_DEC | 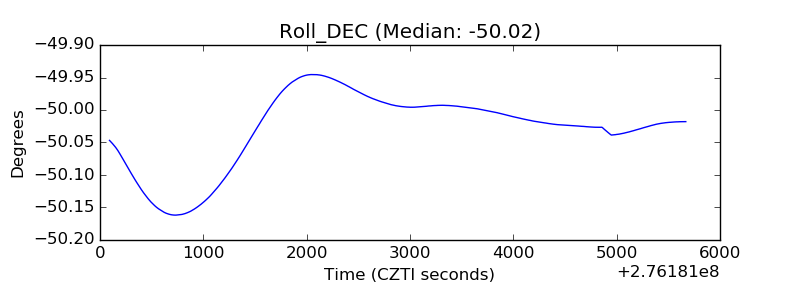 |
| _Roll_RA |  |
| Veto Counter |  |