| Param | Original file | Final file |
|---|---|---|
| Filename | modeM0/AS1A05_212T08_9000002396cztM0_level2_bc.evt | modeM0/AS1A05_212T08_9000002396cztM0_level2_quad_clean.evt |
| Size (bytes) | 175,193,280 | 72,057,600 |
| Size | 167.1 MB | 68.7 MB |
| Events in quadrant A | 1,186,709 | 458,619 |
| Events in quadrant B | 1,194,800 | 463,398 |
| Events in quadrant C | 1,046,680 | 445,284 |
| Events in quadrant D | 1,504,266 | 439,333 |
| Mode M0 | |||
|---|---|---|---|
| Quadrant | BADHDUFLAG | Total packets | Discarded packets |
| A | 0 | 11487 | 0 |
| B | 0 | 11267 | 0 |
| C | 0 | 11045 | 0 |
| D | 0 | 12185 | 0 |
| Mode SS | |||
|---|---|---|---|
| Quadrant | BADHDUFLAG | Total packets | Discarded packets |
| A | 0 | 110 | 0 |
| B | 0 | 110 | 0 |
| C | 0 | 110 | 0 |
| D | 0 | 110 | 0 |
| Mode M9 | |||
|---|---|---|---|
| Quadrant | BADHDUFLAG | Total packets | Discarded packets |
| A | 0 | 9 | 0 |
| B | 0 | 9 | 0 |
| C | 0 | 9 | 0 |
| D | 0 | 9 | 0 |
| Quadrant | Total seconds | Saturated seconds | Saturation percentage |
|---|---|---|---|
| A | 5356 | 115 | 2.147125% |
| B | 5356 | 126 | 2.352502% |
| C | 5356 | 112 | 2.091113% |
| D | 5356 | 86 | 1.605676% |
Noise dominated data is calculated using 1-second bins in cleaned event files. If a bin has >2000 counts, and if more than 50% of those come from <1% of pixels, then it is considered to be noise-dominated and hence unusable.
| Quadrant | # 1 sec bins | Bins with >0 counts | Bins with >2000 counts | High rate bins dominated by noise | Noise dominated (total time) | Noise dominated (detector-on time) | Marked lightcurve |
|---|---|---|---|---|---|---|---|
| A | 6207 | 5357 | 0 | 0 | 0.00% | 0.00% |  |
| B | 6207 | 5357 | 1 | 1 | 0.02% | 0.02% |  |
| C | 6207 | 5357 | 0 | 0 | 0.00% | 0.00% | 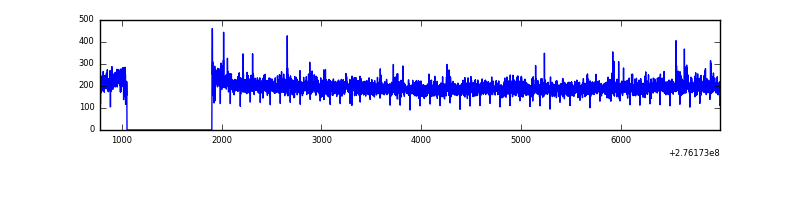 |
| D | 6207 | 5357 | 2 | 2 | 0.03% | 0.04% | 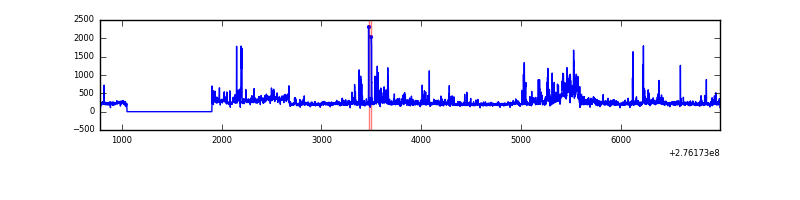 |
Top three noisy pixels from each quadrant. If the there are fewer than three noisy pixels in the level2.evt file, extra rows are filled as -1
| Pixel properties | Quadrant properties | ||||||
|---|---|---|---|---|---|---|---|
| Quadrant | DetID | PixID | Counts | Sigma | Mean | Median | Sigma |
| A | 15 | 174 | 101173 | 1619.21 | 276 | 271 | 62.3 |
| A | 9 | 143 | 14150 | 222.72 | 276 | 271 | 62.3 |
| A | 13 | 248 | 6533 | 100.49 | 276 | 271 | 62.3 |
| B | 0 | 198 | 52651 | 946.53 | 279 | 271 | 55.3 |
| B | 0 | 189 | 26071 | 466.22 | 279 | 271 | 55.3 |
| B | 3 | 209 | 8942 | 156.69 | 279 | 271 | 55.3 |
| C | 3 | 233 | 8831 | 131.79 | 268 | 266 | 65.0 |
| C | 0 | 207 | 5207 | 76.03 | 268 | 266 | 65.0 |
| C | 7 | 247 | 1602 | 20.56 | 268 | 266 | 65.0 |
| D | 1 | 52 | 144072 | 2214.91 | 274 | 264 | 64.9 |
| D | 7 | 38 | 128003 | 1967.42 | 274 | 264 | 64.9 |
| D | 13 | 112 | 87573 | 1344.72 | 274 | 264 | 64.9 |
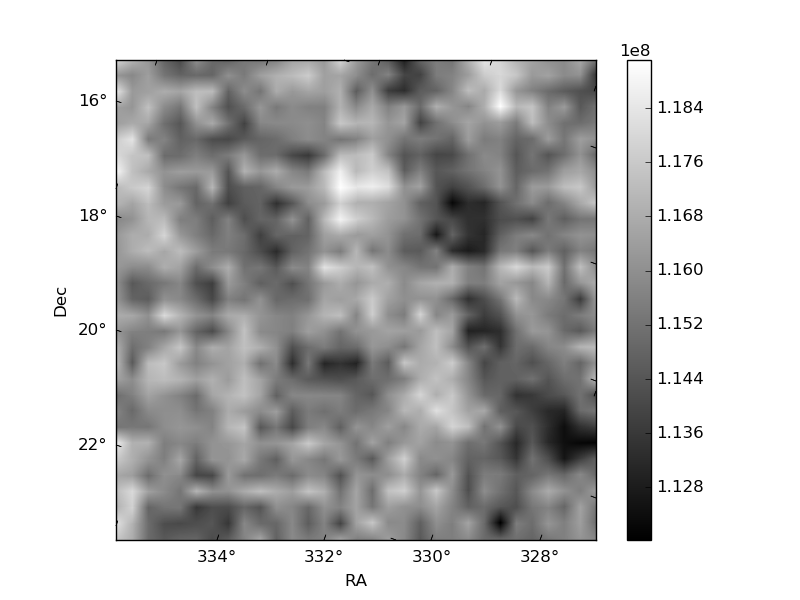
Histogram calculated using DETX and DETY for each event in the final _common_clean file
| Quadrant A |  |
 |
Quadrant B |
|---|---|---|---|
| Quadrant D |  |
 |
Quadrant C |
| Plot type | Count rate plots | Images |
|---|---|---|
| Comparison with Poisson distribution Blue bars denote a histogram of data divided into 1 sec bins. Red curve is a Poisson curve with rate = median count rate of data. |
 |
 |
| Quadrant-wise count rates Data is divided into 100 sec bins |
 |
|
| Module-wise count rates for Quadrant A Data is divided into 100 sec bins |
 |
 |
| Module-wise count rates for Quadrant B Data is divided into 100 sec bins |
 |
 |
| Module-wise count rates for Quadrant C Data is divided into 100 sec bins |
 |
 |
| Module-wise count rates for Quadrant D Data is divided into 100 sec bins |
 |
 |
| Parameter | Plot |
|---|---|
| CZT HV Monitor |  |
| D_VDD |  |
| Temperature 1 |  |
| Veto HV Monitor |  |
| Veto LLD |  |
| Alpha Counter |  |
| _CPM_Rate |  |
| CZT Counter |  |
| +2.5 Volts monitor | 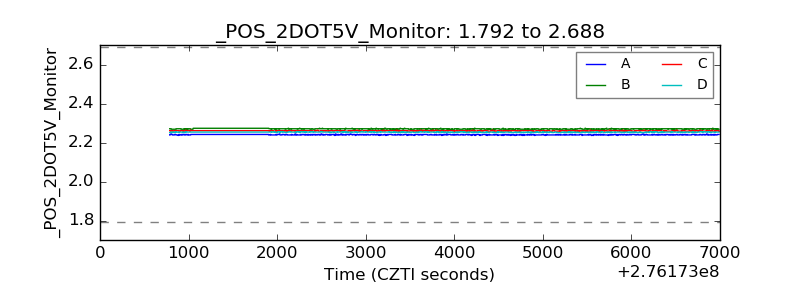 |
| +5 Volts monitor |  |
| _ROLL_ROT |  |
| _Roll_DEC |  |
| _Roll_RA |  |
| Veto Counter |  |