| Param | Original file | Final file |
|---|---|---|
| Filename | modeM0/AS1A05_101T04_9000002402cztM0_level2_bc.evt | modeM0/AS1A05_101T04_9000002402cztM0_level2_quad_clean.evt |
| Size (bytes) | 1,013,351,040 | 382,282,560 |
| Size | 966.4 MB | 364.6 MB |
| Events in quadrant A | 6,860,064 | 2,401,944 |
| Events in quadrant B | 6,819,675 | 2,478,048 |
| Events in quadrant C | 8,151,689 | 2,428,289 |
| Events in quadrant D | 6,995,371 | 2,395,548 |
| Mode M9 | |||
|---|---|---|---|
| Quadrant | BADHDUFLAG | Total packets | Discarded packets |
| A | 0 | 62 | 0 |
| B | 0 | 62 | 0 |
| C | 0 | 62 | 0 |
| D | 0 | 62 | 0 |
| Mode SS | |||
|---|---|---|---|
| Quadrant | BADHDUFLAG | Total packets | Discarded packets |
| A | 0 | 556 | 0 |
| B | 0 | 556 | 0 |
| C | 0 | 556 | 0 |
| D | 0 | 556 | 0 |
| Mode M0 | |||
|---|---|---|---|
| Quadrant | BADHDUFLAG | Total packets | Discarded packets |
| A | 0 | 60015 | 0 |
| B | 0 | 58947 | 0 |
| C | 0 | 65114 | 0 |
| D | 0 | 58934 | 0 |
| Quadrant | Total seconds | Saturated seconds | Saturation percentage |
|---|---|---|---|
| A | 27271 | 343 | 1.257746% |
| B | 27271 | 216 | 0.792050% |
| C | 27271 | 620 | 2.273477% |
| D | 27270 | 227 | 0.832417% |
Noise dominated data is calculated using 1-second bins in cleaned event files. If a bin has >2000 counts, and if more than 50% of those come from <1% of pixels, then it is considered to be noise-dominated and hence unusable.
| Quadrant | # 1 sec bins | Bins with >0 counts | Bins with >2000 counts | High rate bins dominated by noise | Noise dominated (total time) | Noise dominated (detector-on time) | Marked lightcurve |
|---|---|---|---|---|---|---|---|
| A | 33493 | 27274 | 12 | 12 | 0.04% | 0.04% |  |
| B | 33493 | 27272 | 4 | 4 | 0.01% | 0.01% |  |
| C | 33493 | 27273 | 7 | 7 | 0.02% | 0.03% |  |
| D | 33493 | 27272 | 18 | 18 | 0.05% | 0.07% |  |
Top three noisy pixels from each quadrant. If the there are fewer than three noisy pixels in the level2.evt file, extra rows are filled as -1
| Pixel properties | Quadrant properties | ||||||
|---|---|---|---|---|---|---|---|
| Quadrant | DetID | PixID | Counts | Sigma | Mean | Median | Sigma |
| A | 15 | 174 | 870991 | 2658.39 | 1549 | 1527 | 327.1 |
| A | 15 | 239 | 29053 | 84.16 | 1549 | 1527 | 327.1 |
| A | 3 | 1 | 19268 | 54.24 | 1549 | 1527 | 327.1 |
| B | 0 | 198 | 137237 | 466.96 | 1587 | 1555 | 290.6 |
| B | 0 | 189 | 123997 | 421.4 | 1587 | 1555 | 290.6 |
| B | 15 | 35 | 87797 | 296.81 | 1587 | 1555 | 290.6 |
| C | 3 | 233 | 2019847 | 5650.61 | 1540 | 1541 | 357.2 |
| C | 7 | 247 | 142993 | 396.02 | 1540 | 1541 | 357.2 |
| C | 0 | 207 | 80102 | 219.95 | 1540 | 1541 | 357.2 |
| D | 1 | 52 | 343479 | 946.74 | 1565 | 1521 | 361.2 |
| D | 10 | 70 | 287262 | 791.1 | 1565 | 1521 | 361.2 |
| D | 12 | 110 | 167581 | 459.75 | 1565 | 1521 | 361.2 |
Histogram calculated using DETX and DETY for each event in the final _common_clean file
| Quadrant A | 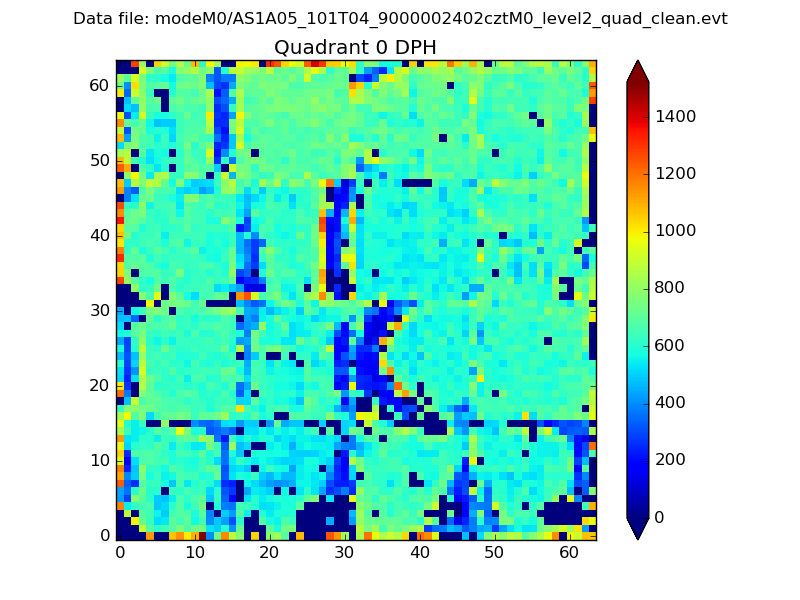 |
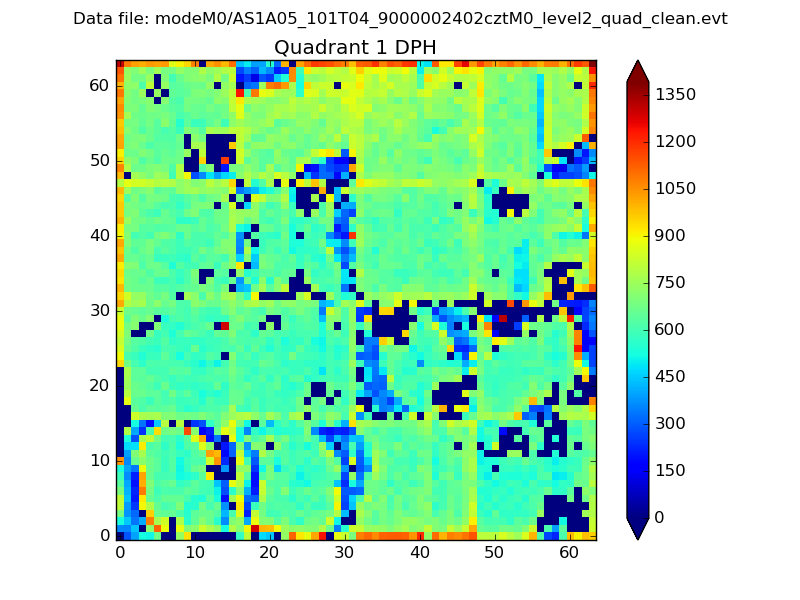 |
Quadrant B |
|---|---|---|---|
| Quadrant D |  |
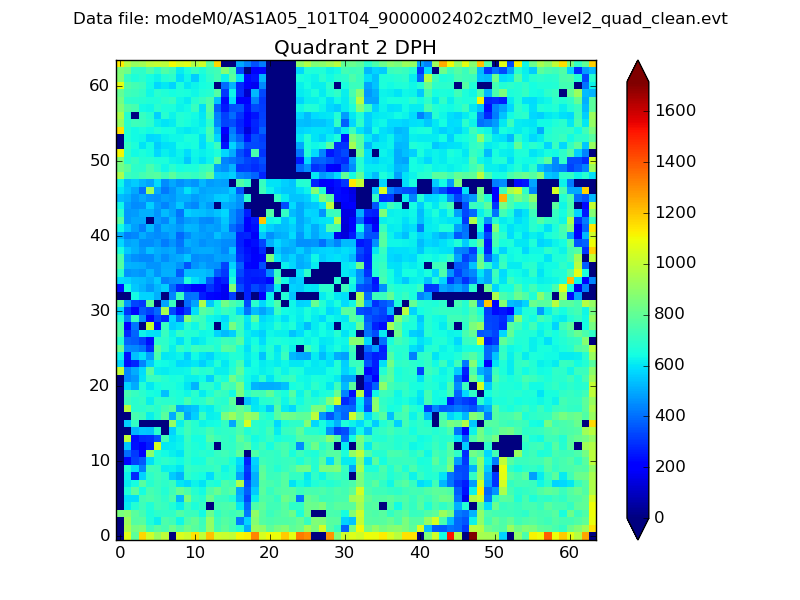 |
Quadrant C |
| Plot type | Count rate plots | Images |
|---|---|---|
| Comparison with Poisson distribution Blue bars denote a histogram of data divided into 1 sec bins. Red curve is a Poisson curve with rate = median count rate of data. |
 |
 |
| Quadrant-wise count rates Data is divided into 100 sec bins |
 |
|
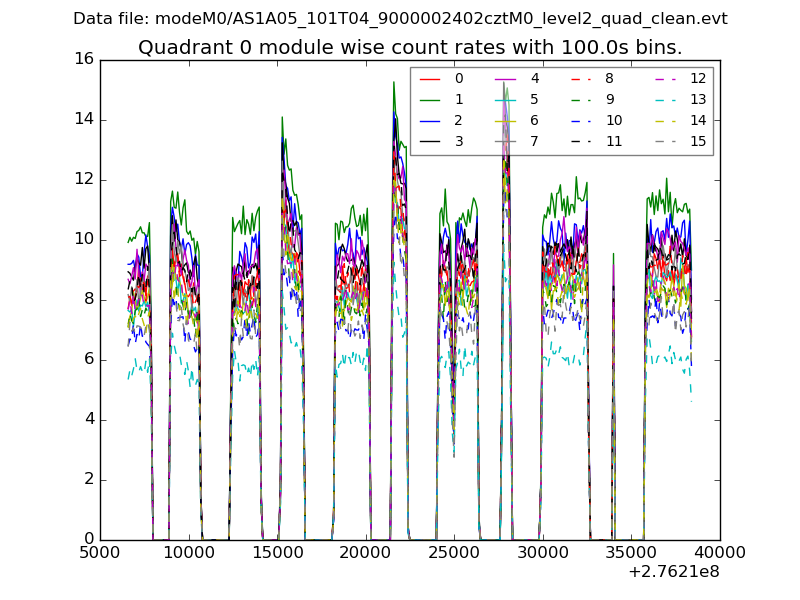
| Module-wise count rates for Quadrant A Data is divided into 100 sec bins |
 |
 |
| Module-wise count rates for Quadrant B Data is divided into 100 sec bins |
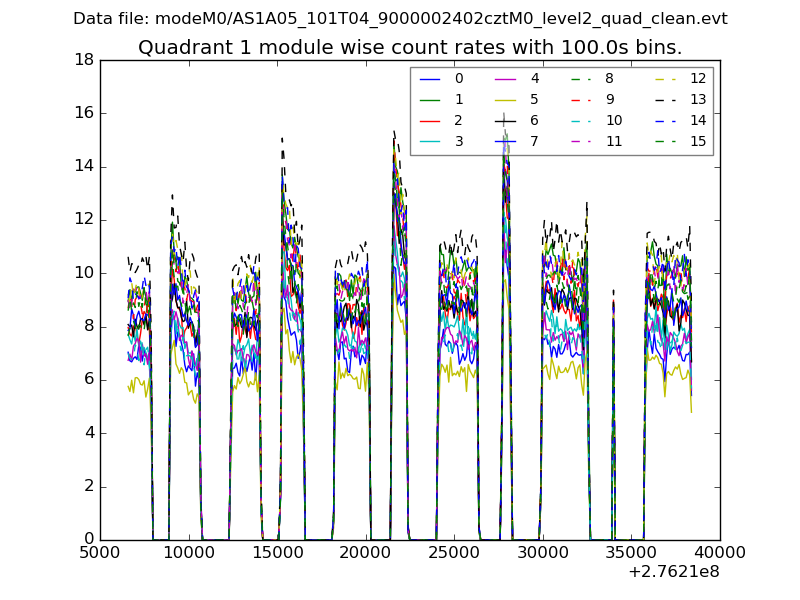 |
 |
| Module-wise count rates for Quadrant C Data is divided into 100 sec bins |
 |
 |
| Module-wise count rates for Quadrant D Data is divided into 100 sec bins |
 |
 |
| Parameter | Plot |
|---|---|
| CZT HV Monitor | 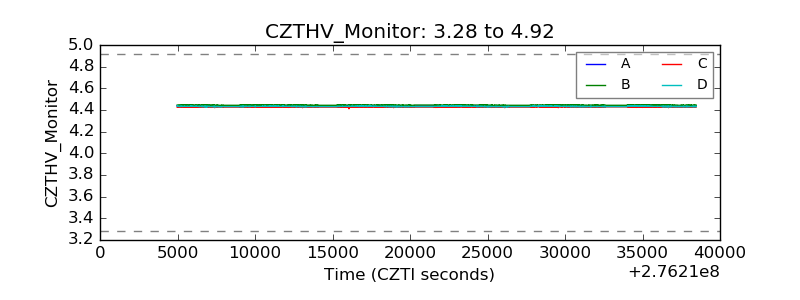 |
| D_VDD | 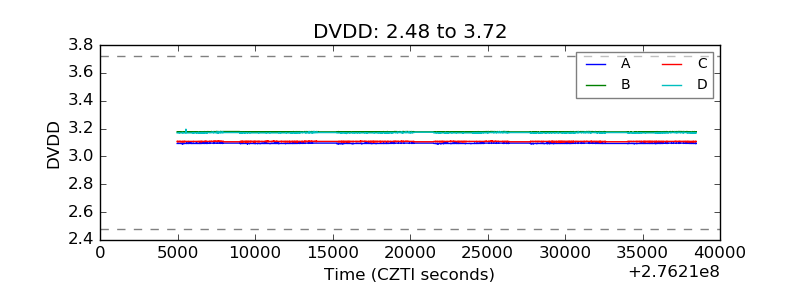 |
| Temperature 1 |  |
| Veto HV Monitor |  |
| Veto LLD | 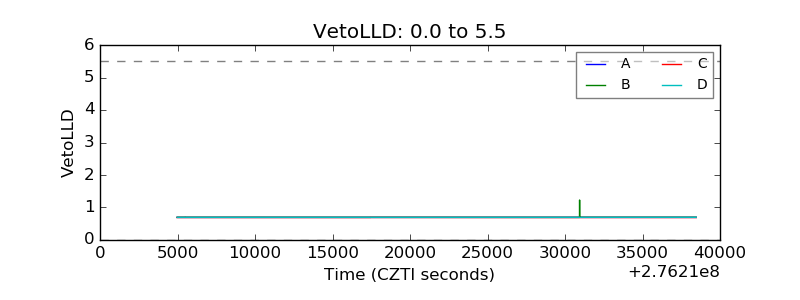 |
| Alpha Counter |  |
| _CPM_Rate |  |
| CZT Counter |  |
| +2.5 Volts monitor | 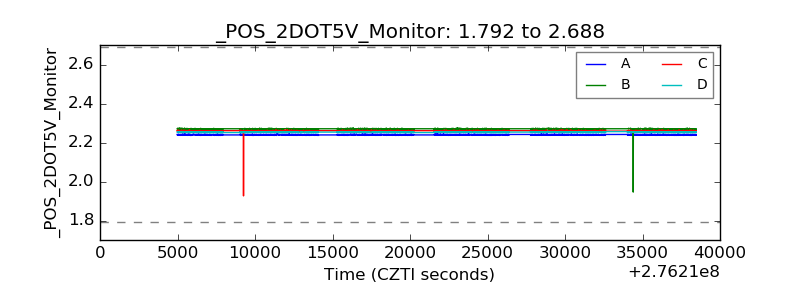 |
| +5 Volts monitor |  |
| _ROLL_ROT |  |
| _Roll_DEC |  |
| _Roll_RA | 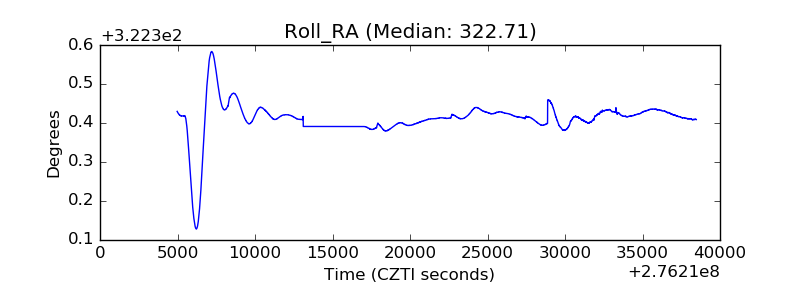 |
| Veto Counter |  |