| Param | Original file | Final file |
|---|---|---|
| Filename | modeM0/AS1A05_072T05_9000002394cztM0_level2_bc.evt | modeM0/AS1A05_072T05_9000002394cztM0_level2_quad_clean.evt |
| Size (bytes) | 2,717,582,400 | 993,617,280 |
| Size | 2.5 GB | 947.6 MB |
| Events in quadrant A | 18,496,468 | 6,214,567 |
| Events in quadrant B | 20,985,358 | 6,316,921 |
| Events in quadrant C | 16,444,762 | 6,266,913 |
| Events in quadrant D | 21,224,294 | 6,114,719 |
| Mode M0 | |||
|---|---|---|---|
| Quadrant | BADHDUFLAG | Total packets | Discarded packets |
| A | 0 | 167158 | 0 |
| B | 0 | 176197 | 0 |
| C | 0 | 160783 | 0 |
| D | 0 | 175002 | 0 |
| Mode SS | |||
|---|---|---|---|
| Quadrant | BADHDUFLAG | Total packets | Discarded packets |
| A | 0 | 1540 | 0 |
| B | 0 | 1540 | 0 |
| C | 0 | 1540 | 0 |
| D | 0 | 1540 | 0 |
| Mode M9 | |||
|---|---|---|---|
| Quadrant | BADHDUFLAG | Total packets | Discarded packets |
| A | 0 | 118 | 0 |
| B | 0 | 118 | 0 |
| C | 0 | 118 | 0 |
| D | 0 | 118 | 0 |
| Quadrant | Total seconds | Saturated seconds | Saturation percentage |
|---|---|---|---|
| A | 75584 | 1543 | 2.041437% |
| B | 75584 | 2256 | 2.984759% |
| C | 75584 | 1405 | 1.858859% |
| D | 75584 | 1576 | 2.085097% |
Noise dominated data is calculated using 1-second bins in cleaned event files. If a bin has >2000 counts, and if more than 50% of those come from <1% of pixels, then it is considered to be noise-dominated and hence unusable.
| Quadrant | # 1 sec bins | Bins with >0 counts | Bins with >2000 counts | High rate bins dominated by noise | Noise dominated (total time) | Noise dominated (detector-on time) | Marked lightcurve |
|---|---|---|---|---|---|---|---|
| A | 87555 | 75585 | 74 | 74 | 0.08% | 0.10% |  |
| B | 87555 | 75584 | 122 | 122 | 0.14% | 0.16% |  |
| C | 87555 | 75585 | 1 | 1 | 0.00% | 0.00% |  |
| D | 87555 | 75580 | 114 | 114 | 0.13% | 0.15% |  |
Top three noisy pixels from each quadrant. If the there are fewer than three noisy pixels in the level2.evt file, extra rows are filled as -1
| Pixel properties | Quadrant properties | ||||||
|---|---|---|---|---|---|---|---|
| Quadrant | DetID | PixID | Counts | Sigma | Mean | Median | Sigma |
| A | 15 | 174 | 2299123 | 2639.22 | 4031 | 3956 | 869.6 |
| A | 9 | 143 | 583997 | 666.99 | 4031 | 3956 | 869.6 |
| A | 15 | 239 | 83919 | 91.95 | 4031 | 3956 | 869.6 |
| B | 3 | 112 | 2016423 | 2614.87 | 4093 | 3994 | 769.6 |
| B | 0 | 189 | 690283 | 891.74 | 4093 | 3994 | 769.6 |
| B | 5 | 65 | 628904 | 811.98 | 4093 | 3994 | 769.6 |
| C | 3 | 233 | 898998 | 977.85 | 3961 | 3942 | 915.3 |
| C | 0 | 207 | 310414 | 334.82 | 3961 | 3942 | 915.3 |
| C | 13 | 61 | 23310 | 21.16 | 3961 | 3942 | 915.3 |
| D | 1 | 52 | 4198039 | 4546.07 | 4029 | 3895 | 922.6 |
| D | 10 | 70 | 892644 | 963.32 | 4029 | 3895 | 922.6 |
| D | 15 | 0 | 458818 | 493.09 | 4029 | 3895 | 922.6 |
Histogram calculated using DETX and DETY for each event in the final _common_clean file
| Quadrant A | 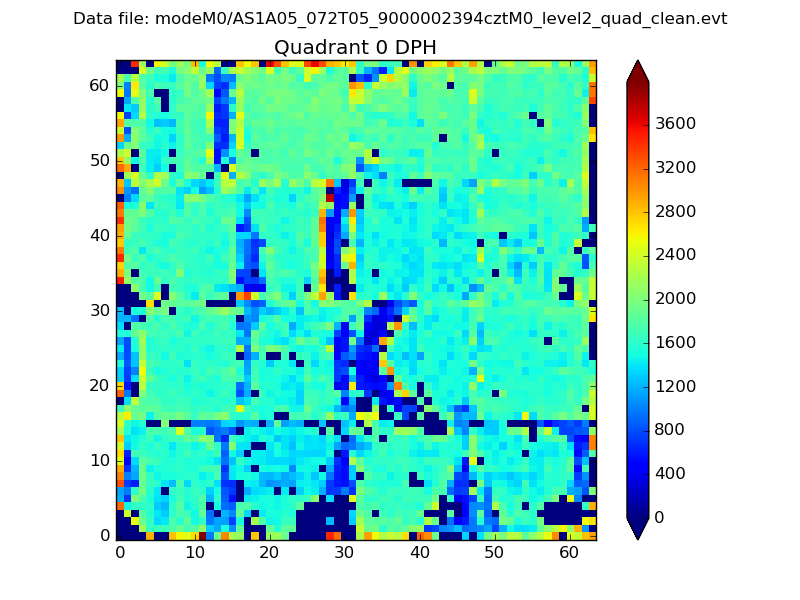 |
 |
Quadrant B |
|---|---|---|---|
| Quadrant D |  |
 |
Quadrant C |
| Plot type | Count rate plots | Images |
|---|---|---|
| Comparison with Poisson distribution Blue bars denote a histogram of data divided into 1 sec bins. Red curve is a Poisson curve with rate = median count rate of data. |
 |
 |
| Quadrant-wise count rates Data is divided into 100 sec bins |
 |
|
| Module-wise count rates for Quadrant A Data is divided into 100 sec bins |
 |
 |
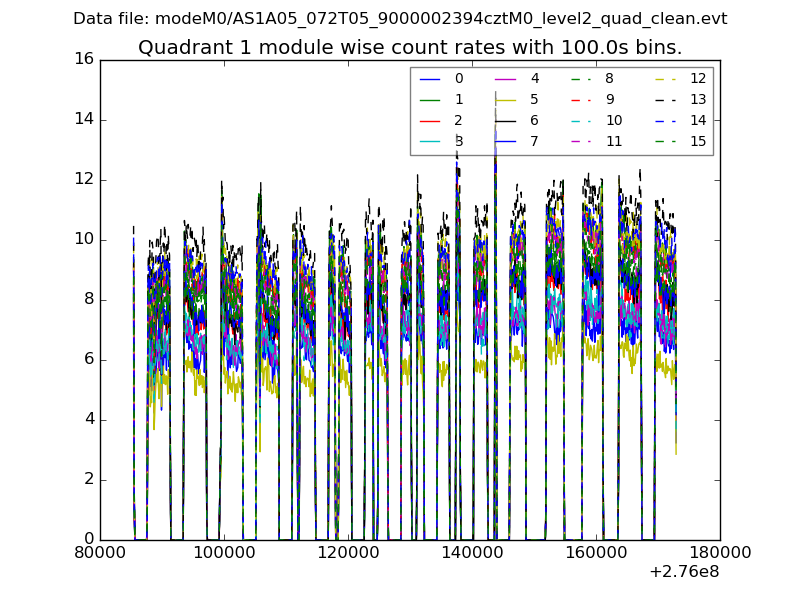
| Module-wise count rates for Quadrant B Data is divided into 100 sec bins |
 |
 |
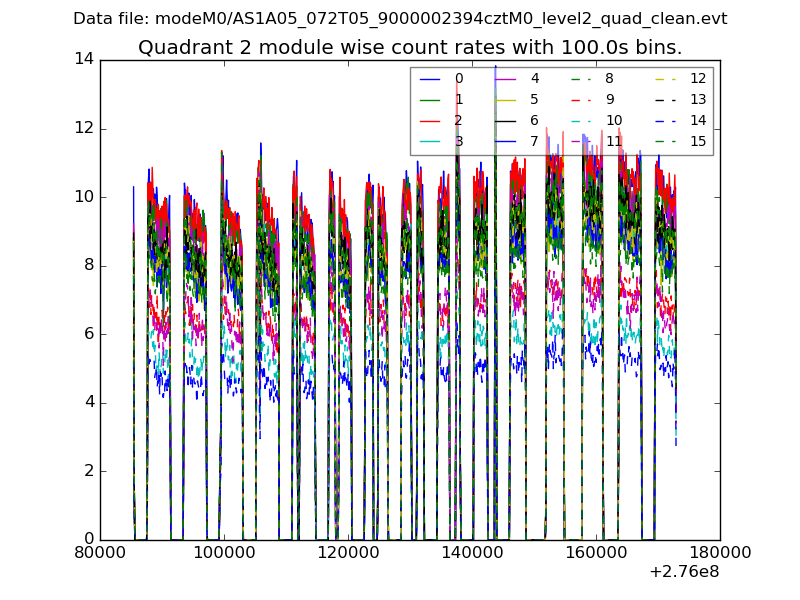
| Module-wise count rates for Quadrant C Data is divided into 100 sec bins |
 |
 |
| Module-wise count rates for Quadrant D Data is divided into 100 sec bins |
 |
 |
| Parameter | Plot |
|---|---|
| CZT HV Monitor | 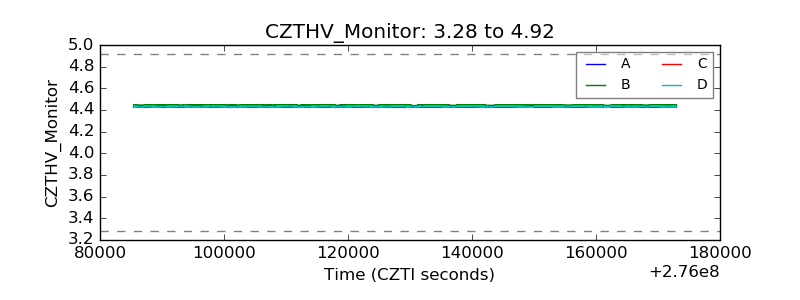 |
| D_VDD |  |
| Temperature 1 |  |
| Veto HV Monitor |  |
| Veto LLD |  |
| Alpha Counter | 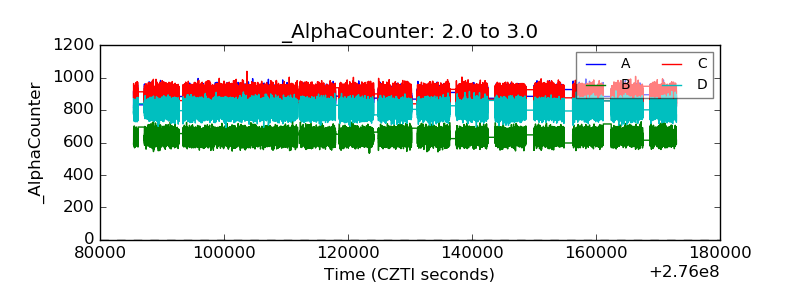 |
| _CPM_Rate | 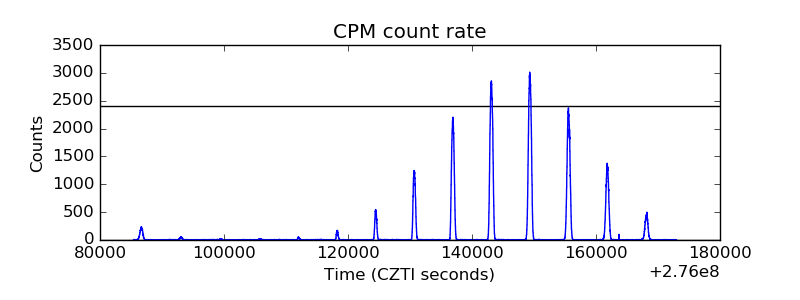 |
| CZT Counter |  |
| +2.5 Volts monitor |  |
| +5 Volts monitor |  |
| _ROLL_ROT |  |
| _Roll_DEC |  |
| _Roll_RA | 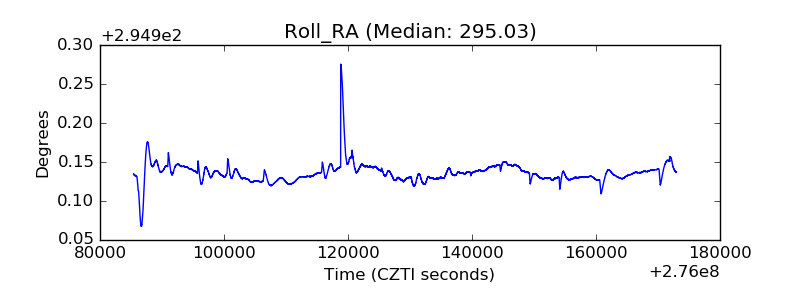 |
| Veto Counter | 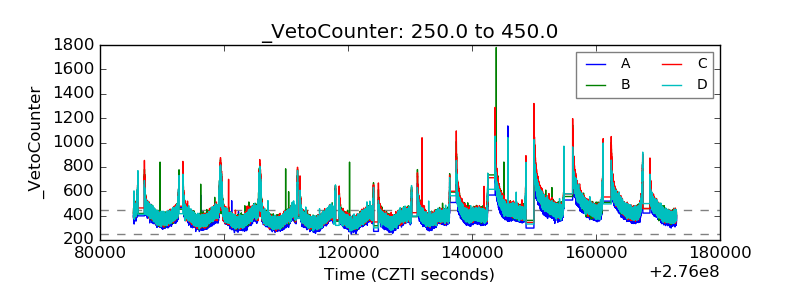 |