| Param | Original file | Final file |
|---|---|---|
| Filename | modeM0/AS1T02_112T01_9000002390cztM0_level2_bc.evt | modeM0/AS1T02_112T01_9000002390cztM0_level2_quad_clean.evt |
| Size (bytes) | 8,893,238,400 | 3,156,454,080 |
| Size | 8.3 GB | 2.9 GB |
| Events in quadrant A | 65,470,019 | 19,976,594 |
| Events in quadrant B | 69,236,189 | 20,200,408 |
| Events in quadrant C | 54,033,505 | 20,054,386 |
| Events in quadrant D | 64,956,121 | 19,637,724 |
| Mode SS | |||
|---|---|---|---|
| Quadrant | BADHDUFLAG | Total packets | Discarded packets |
| A | 0 | 4686 | 0 |
| B | 0 | 4686 | 0 |
| C | 0 | 4686 | 0 |
| D | 0 | 4686 | 0 |
| Mode M9 | |||
|---|---|---|---|
| Quadrant | BADHDUFLAG | Total packets | Discarded packets |
| A | 0 | 356 | 0 |
| B | 0 | 356 | 0 |
| C | 0 | 356 | 0 |
| D | 0 | 357 | 0 |
| Mode M0 | |||
|---|---|---|---|
| Quadrant | BADHDUFLAG | Total packets | Discarded packets |
| A | 0 | 549461 | 0 |
| B | 0 | 558411 | 0 |
| C | 0 | 501282 | 0 |
| D | 0 | 529571 | 0 |
| Quadrant | Total seconds | Saturated seconds | Saturation percentage |
|---|---|---|---|
| A | 229802 | 8104 | 3.526514% |
| B | 229807 | 6980 | 3.037331% |
| C | 229809 | 3787 | 1.647890% |
| D | 229807 | 4547 | 1.978617% |
Noise dominated data is calculated using 1-second bins in cleaned event files. If a bin has >2000 counts, and if more than 50% of those come from <1% of pixels, then it is considered to be noise-dominated and hence unusable.
| Quadrant | # 1 sec bins | Bins with >0 counts | Bins with >2000 counts | High rate bins dominated by noise | Noise dominated (total time) | Noise dominated (detector-on time) | Marked lightcurve |
|---|---|---|---|---|---|---|---|
| A | 267552 | 229808 | 552 | 552 | 0.21% | 0.24% |  |
| B | 267552 | 229806 | 549 | 549 | 0.21% | 0.24% |  |
| C | 267552 | 229825 | 17 | 17 | 0.01% | 0.01% |  |
| D | 267552 | 229820 | 689 | 689 | 0.26% | 0.30% |  |
Top three noisy pixels from each quadrant. If the there are fewer than three noisy pixels in the level2.evt file, extra rows are filled as -1
| Pixel properties | Quadrant properties | ||||||
|---|---|---|---|---|---|---|---|
| Quadrant | DetID | PixID | Counts | Sigma | Mean | Median | Sigma |
| A | 15 | 174 | 14030600 | 5259.99 | 12416 | 12236 | 2665.1 |
| A | 0 | 253 | 925854 | 342.81 | 12416 | 12236 | 2665.1 |
| A | 9 | 143 | 734492 | 271.01 | 12416 | 12236 | 2665.1 |
| B | 3 | 112 | 6346431 | 2715.89 | 12542 | 12256 | 2332.3 |
| B | 7 | 220 | 2930701 | 1251.33 | 12542 | 12256 | 2332.3 |
| B | 0 | 198 | 1660903 | 706.89 | 12542 | 12256 | 2332.3 |
| C | 3 | 233 | 5550976 | 1961.79 | 12143 | 12120 | 2823.4 |
| C | 0 | 207 | 1278179 | 448.42 | 12143 | 12120 | 2823.4 |
| C | 7 | 247 | 444060 | 152.99 | 12143 | 12120 | 2823.4 |
| D | 1 | 52 | 12231718 | 4270.03 | 12406 | 12009 | 2861.7 |
| D | 15 | 0 | 1712115 | 594.08 | 12406 | 12009 | 2861.7 |
| D | 2 | 234 | 906521 | 312.58 | 12406 | 12009 | 2861.7 |
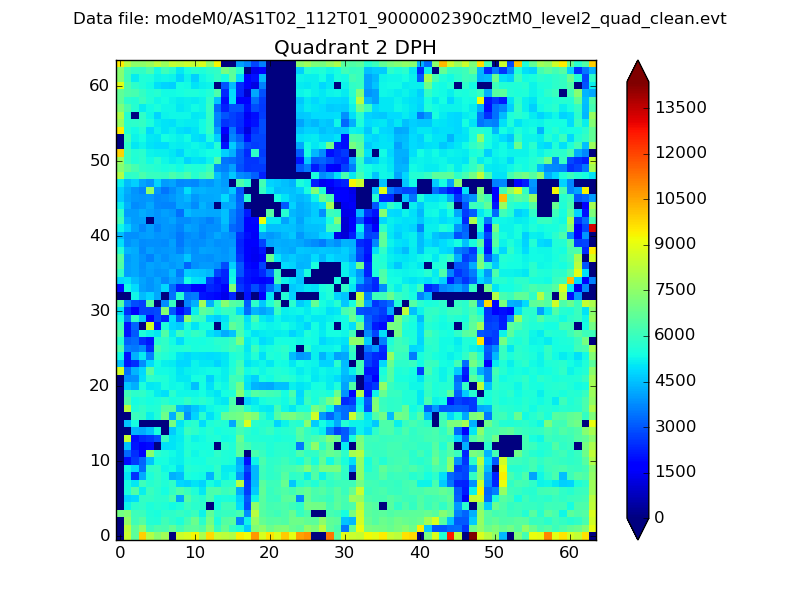
Histogram calculated using DETX and DETY for each event in the final _common_clean file
| Quadrant A |  |
 |
Quadrant B |
|---|---|---|---|
| Quadrant D | 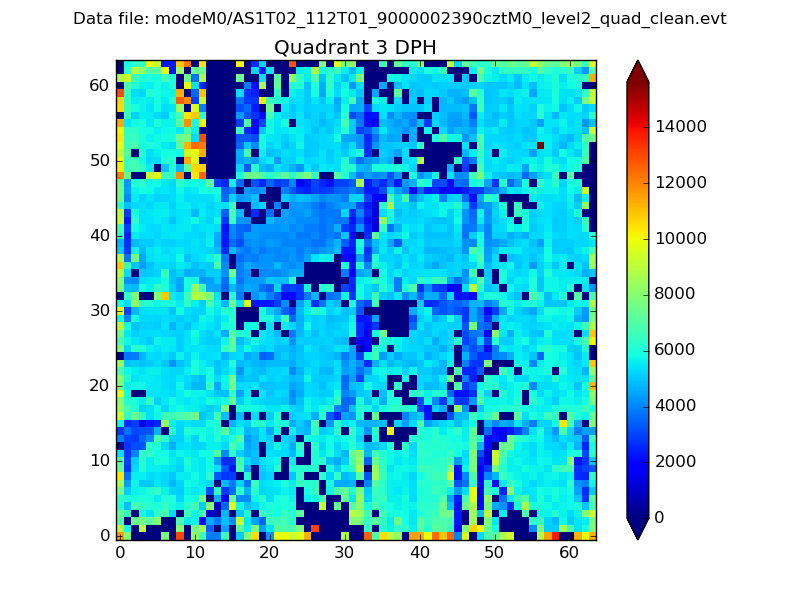 |
 |
Quadrant C |
| Plot type | Count rate plots | Images |
|---|---|---|
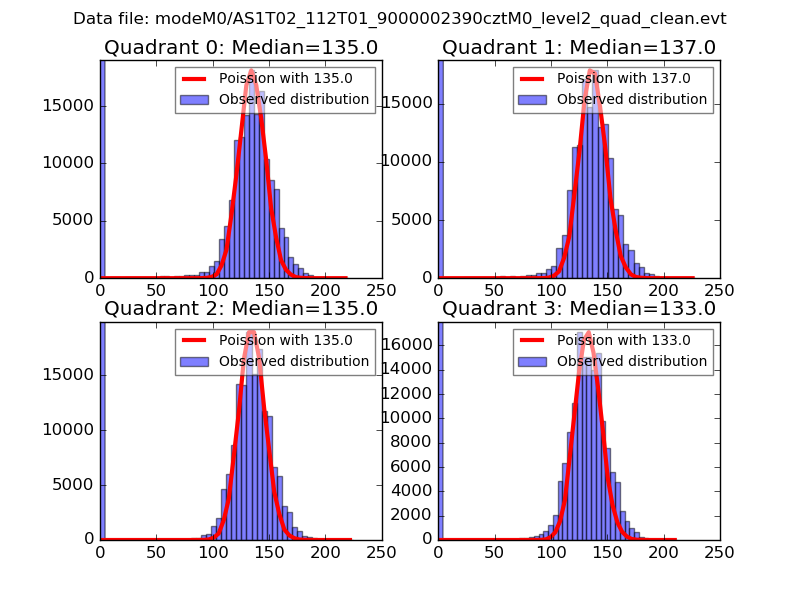
| Comparison with Poisson distribution Blue bars denote a histogram of data divided into 1 sec bins. Red curve is a Poisson curve with rate = median count rate of data. |
 |
 |
| Quadrant-wise count rates Data is divided into 100 sec bins |
 |
|
| Module-wise count rates for Quadrant A Data is divided into 100 sec bins |
 |
 |
| Module-wise count rates for Quadrant B Data is divided into 100 sec bins |
 |
 |
| Module-wise count rates for Quadrant C Data is divided into 100 sec bins |
 |
 |
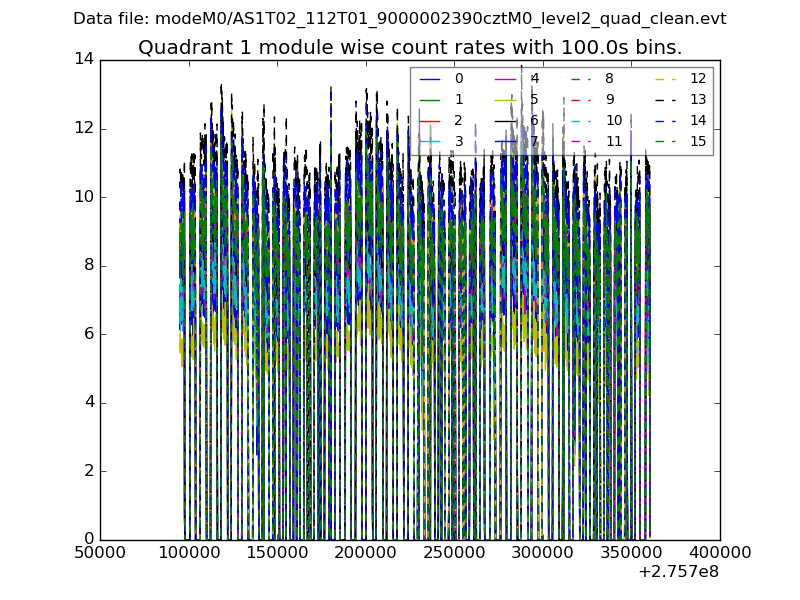
| Module-wise count rates for Quadrant D Data is divided into 100 sec bins |
 |
 |
| Parameter | Plot |
|---|---|
| CZT HV Monitor |  |
| D_VDD |  |
| Temperature 1 |  |
| Veto HV Monitor |  |
| Veto LLD |  |
| Alpha Counter | 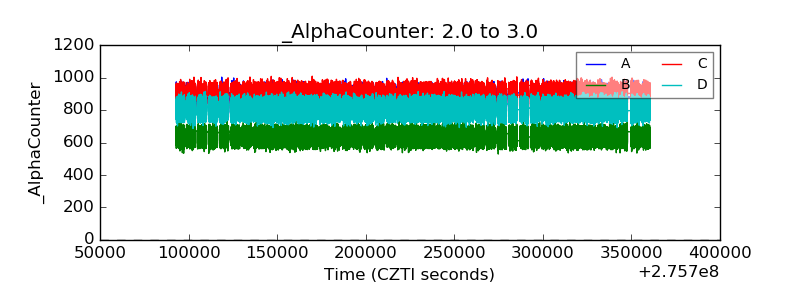 |
| _CPM_Rate |  |
| CZT Counter |  |
| +2.5 Volts monitor |  |
| +5 Volts monitor |  |
| _ROLL_ROT |  |
| _Roll_DEC | 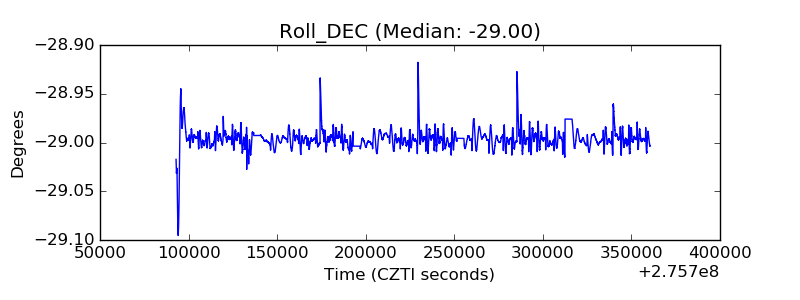 |
| _Roll_RA |  |
| Veto Counter | 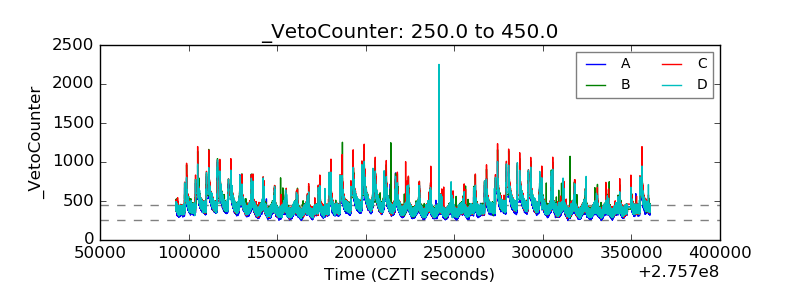 |