| Param | Original file | Final file |
|---|---|---|
| Filename | modeM0/AS1T02_110T01_9000002388cztM0_level2_bc.evt | modeM0/AS1T02_110T01_9000002388cztM0_level2_quad_clean.evt |
| Size (bytes) | 1,021,858,560 | 381,597,120 |
| Size | 974.5 MB | 363.9 MB |
| Events in quadrant A | 8,582,965 | 2,405,768 |
| Events in quadrant B | 7,021,019 | 2,415,703 |
| Events in quadrant C | 5,923,297 | 2,320,307 |
| Events in quadrant D | 7,337,655 | 2,322,050 |
| Mode M9 | |||
|---|---|---|---|
| Quadrant | BADHDUFLAG | Total packets | Discarded packets |
| A | 0 | 29 | 0 |
| B | 0 | 29 | 0 |
| C | 0 | 29 | 0 |
| D | 0 | 29 | 0 |
| Mode SS | |||
|---|---|---|---|
| Quadrant | BADHDUFLAG | Total packets | Discarded packets |
| A | 0 | 620 | 0 |
| B | 0 | 620 | 0 |
| C | 0 | 620 | 0 |
| D | 0 | 620 | 0 |
| Mode M0 | |||
|---|---|---|---|
| Quadrant | BADHDUFLAG | Total packets | Discarded packets |
| A | 0 | 72051 | 0 |
| B | 0 | 66098 | 0 |
| C | 0 | 62599 | 0 |
| D | 0 | 66609 | 0 |
| Quadrant | Total seconds | Saturated seconds | Saturation percentage |
|---|---|---|---|
| A | 30473 | 751 | 2.464477% |
| B | 30473 | 370 | 1.214190% |
| C | 30473 | 340 | 1.115742% |
| D | 30473 | 289 | 0.948381% |
Noise dominated data is calculated using 1-second bins in cleaned event files. If a bin has >2000 counts, and if more than 50% of those come from <1% of pixels, then it is considered to be noise-dominated and hence unusable.
| Quadrant | # 1 sec bins | Bins with >0 counts | Bins with >2000 counts | High rate bins dominated by noise | Noise dominated (total time) | Noise dominated (detector-on time) | Marked lightcurve |
|---|---|---|---|---|---|---|---|
| A | 32859 | 30475 | 36 | 36 | 0.11% | 0.12% |  |
| B | 32859 | 30475 | 3 | 3 | 0.01% | 0.01% | 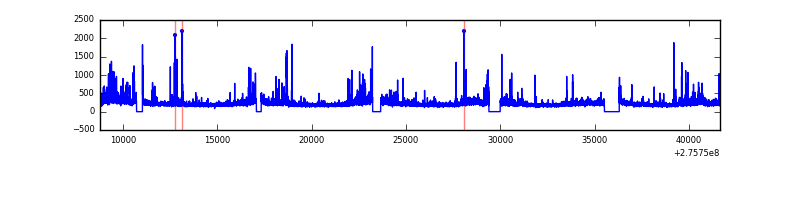 |
| C | 32859 | 30474 | 1 | 1 | 0.00% | 0.00% |  |
| D | 32859 | 30475 | 20 | 20 | 0.06% | 0.07% |  |
Top three noisy pixels from each quadrant. If the there are fewer than three noisy pixels in the level2.evt file, extra rows are filled as -1
| Pixel properties | Quadrant properties | ||||||
|---|---|---|---|---|---|---|---|
| Quadrant | DetID | PixID | Counts | Sigma | Mean | Median | Sigma |
| A | 15 | 174 | 1372277 | 4157.2 | 1509 | 1480 | 329.7 |
| A | 4 | 2 | 418737 | 1265.41 | 1509 | 1480 | 329.7 |
| A | 0 | 253 | 416203 | 1257.72 | 1509 | 1480 | 329.7 |
| B | 3 | 64 | 371417 | 1267.81 | 1517 | 1475 | 291.8 |
| B | 0 | 198 | 239564 | 815.94 | 1517 | 1475 | 291.8 |
| B | 0 | 219 | 138299 | 468.9 | 1517 | 1475 | 291.8 |
| C | 7 | 247 | 154677 | 443.37 | 1459 | 1445 | 345.6 |
| C | 0 | 207 | 69171 | 195.96 | 1459 | 1445 | 345.6 |
| C | 3 | 233 | 67188 | 190.23 | 1459 | 1445 | 345.6 |
| D | 2 | 233 | 861038 | 2451.09 | 1507 | 1453 | 350.7 |
| D | 1 | 52 | 219710 | 622.36 | 1507 | 1453 | 350.7 |
| D | 15 | 0 | 166054 | 469.36 | 1507 | 1453 | 350.7 |
Histogram calculated using DETX and DETY for each event in the final _common_clean file
| Quadrant A | 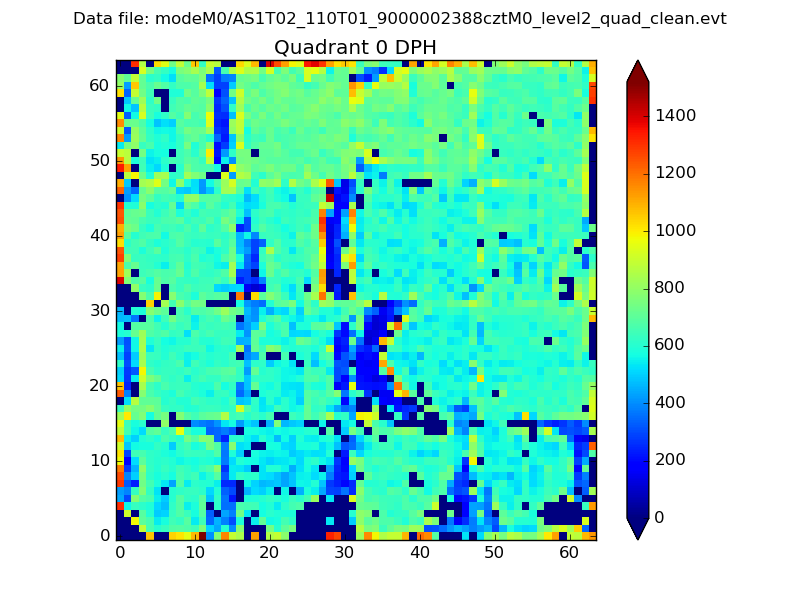 |
 |
Quadrant B |
|---|---|---|---|
| Quadrant D |  |
 |
Quadrant C |
| Plot type | Count rate plots | Images |
|---|---|---|
| Comparison with Poisson distribution Blue bars denote a histogram of data divided into 1 sec bins. Red curve is a Poisson curve with rate = median count rate of data. |
 |
 |
| Quadrant-wise count rates Data is divided into 100 sec bins |
 |
|
| Module-wise count rates for Quadrant A Data is divided into 100 sec bins |
 |
 |
| Module-wise count rates for Quadrant B Data is divided into 100 sec bins |
 |
 |
| Module-wise count rates for Quadrant C Data is divided into 100 sec bins |
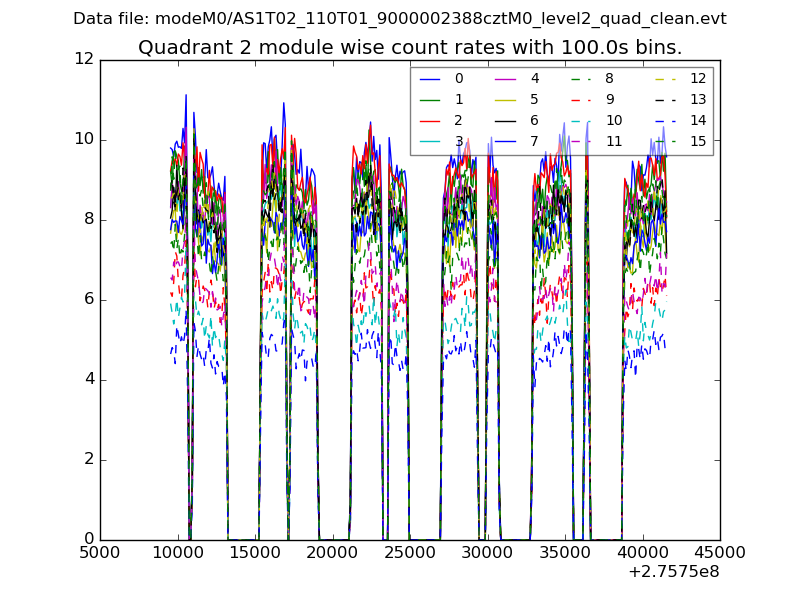 |
 |
| Module-wise count rates for Quadrant D Data is divided into 100 sec bins |
 |
 |
| Parameter | Plot |
|---|---|
| CZT HV Monitor |  |
| D_VDD |  |
| Temperature 1 | 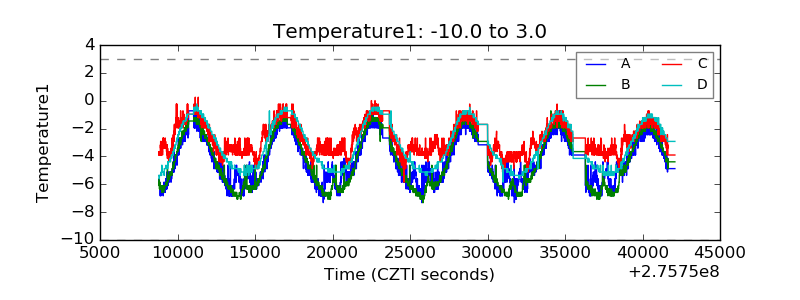 |
| Veto HV Monitor | 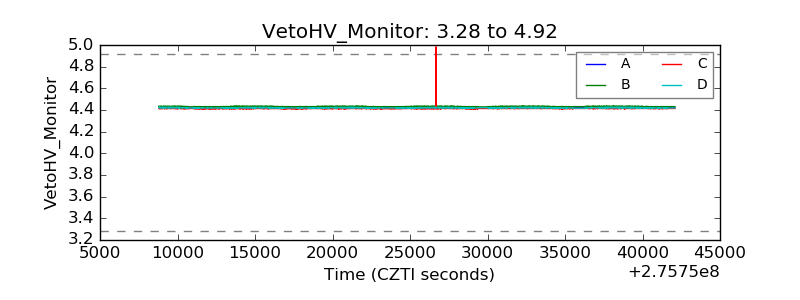 |
| Veto LLD |  |
| Alpha Counter |  |
| _CPM_Rate |  |
| CZT Counter |  |
| +2.5 Volts monitor |  |
| +5 Volts monitor |  |
| _ROLL_ROT |  |
| _Roll_DEC |  |
| _Roll_RA |  |
| Veto Counter |  |