| Param | Original file | Final file |
|---|---|---|
| Filename | modeM0/AS1T02_109T01_9000002386cztM0_level2_bc.evt | modeM0/AS1T02_109T01_9000002386cztM0_level2_quad_clean.evt |
| Size (bytes) | 12,150,106,560 | 3,767,771,520 |
| Size | 11.3 GB | 3.5 GB |
| Events in quadrant A | 82,713,185 | 23,494,657 |
| Events in quadrant B | 74,079,154 | 24,068,193 |
| Events in quadrant C | 75,768,470 | 23,010,783 |
| Events in quadrant D | 114,208,908 | 22,212,697 |
| Mode M0 | |||
|---|---|---|---|
| Quadrant | BADHDUFLAG | Total packets | Discarded packets |
| A | 0 | 721782 | 0 |
| B | 0 | 677146 | 0 |
| C | 0 | 688627 | 0 |
| D | 0 | 828990 | 0 |
| Mode M9 | |||
|---|---|---|---|
| Quadrant | BADHDUFLAG | Total packets | Discarded packets |
| A | 0 | 519 | 0 |
| B | 0 | 515 | 0 |
| C | 0 | 520 | 0 |
| D | 0 | 520 | 0 |
| Mode SS | |||
|---|---|---|---|
| Quadrant | BADHDUFLAG | Total packets | Discarded packets |
| A | 0 | 6351 | 0 |
| B | 0 | 6377 | 0 |
| C | 0 | 5607 | 0 |
| D | 0 | 6372 | 0 |
| Quadrant | Total seconds | Saturated seconds | Saturation percentage |
|---|---|---|---|
| A | 312221 | 9460 | 3.029905% |
| B | 312205 | 4662 | 1.493250% |
| C | 312186 | 6431 | 2.059990% |
| D | 311672 | 16415 | 5.266755% |
Noise dominated data is calculated using 1-second bins in cleaned event files. If a bin has >2000 counts, and if more than 50% of those come from <1% of pixels, then it is considered to be noise-dominated and hence unusable.
| Quadrant | # 1 sec bins | Bins with >0 counts | Bins with >2000 counts | High rate bins dominated by noise | Noise dominated (total time) | Noise dominated (detector-on time) | Marked lightcurve |
|---|---|---|---|---|---|---|---|
| A | 396707 | 313815 | 330 | 330 | 0.08% | 0.11% |  |
| B | 396707 | 313769 | 105 | 105 | 0.03% | 0.03% |  |
| C | 396707 | 313843 | 158 | 158 | 0.04% | 0.05% |  |
| D | 396707 | 313282 | 2214 | 2214 | 0.56% | 0.71% | 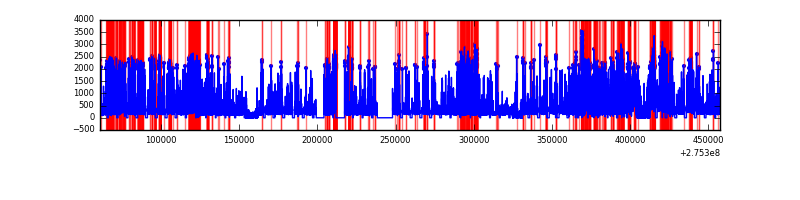 |
Top three noisy pixels from each quadrant. If the there are fewer than three noisy pixels in the level2.evt file, extra rows are filled as -1
| Pixel properties | Quadrant properties | ||||||
|---|---|---|---|---|---|---|---|
| Quadrant | DetID | PixID | Counts | Sigma | Mean | Median | Sigma |
| A | 15 | 174 | 13217983 | 3738.52 | 16458 | 16163 | 3531.3 |
| A | 8 | 247 | 2575014 | 724.62 | 16458 | 16163 | 3531.3 |
| A | 0 | 253 | 1738483 | 487.73 | 16458 | 16163 | 3531.3 |
| B | 5 | 65 | 1687549 | 541.52 | 16709 | 16330 | 3086.2 |
| B | 4 | 216 | 1082885 | 345.59 | 16709 | 16330 | 3086.2 |
| B | 0 | 229 | 1038042 | 331.06 | 16709 | 16330 | 3086.2 |
| C | 3 | 233 | 10266928 | 2800.98 | 15874 | 15788 | 3659.8 |
| C | 7 | 247 | 3414895 | 928.76 | 15874 | 15788 | 3659.8 |
| C | 0 | 207 | 746657 | 199.7 | 15874 | 15788 | 3659.8 |
| D | 1 | 52 | 30251669 | 8253.05 | 15990 | 15424 | 3663.6 |
| D | 2 | 233 | 8527646 | 2323.43 | 15990 | 15424 | 3663.6 |
| D | 5 | 222 | 4411933 | 1200.04 | 15990 | 15424 | 3663.6 |
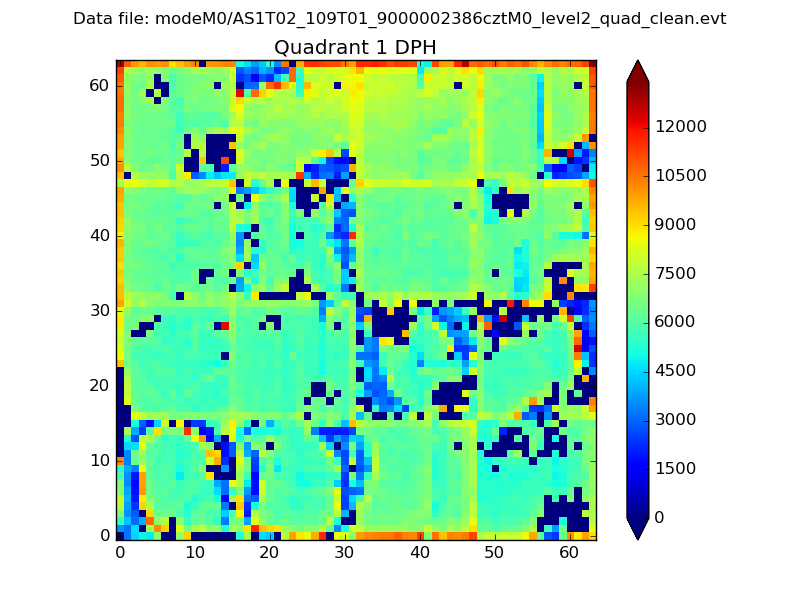
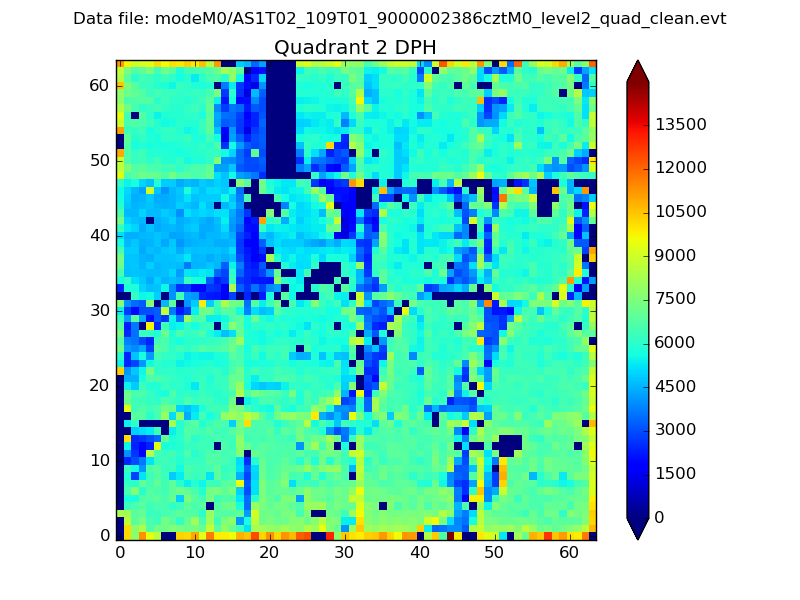
Histogram calculated using DETX and DETY for each event in the final _common_clean file
| Quadrant A |  |
 |
Quadrant B |
|---|---|---|---|
| Quadrant D |  |
 |
Quadrant C |
| Plot type | Count rate plots | Images |
|---|---|---|
| Comparison with Poisson distribution Blue bars denote a histogram of data divided into 1 sec bins. Red curve is a Poisson curve with rate = median count rate of data. |
 |
 |
| Quadrant-wise count rates Data is divided into 100 sec bins |
 |
|
| Module-wise count rates for Quadrant A Data is divided into 100 sec bins |
 |
 |
| Module-wise count rates for Quadrant B Data is divided into 100 sec bins |
 |
 |
| Module-wise count rates for Quadrant C Data is divided into 100 sec bins |
 |
 |
| Module-wise count rates for Quadrant D Data is divided into 100 sec bins |
 |
 |
| Parameter | Plot |
|---|---|
| CZT HV Monitor | 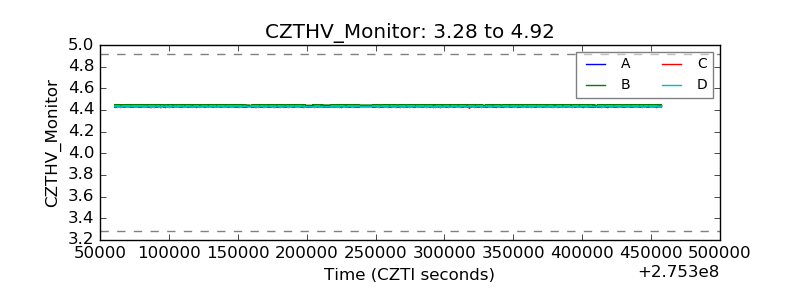 |
| D_VDD |  |
| Temperature 1 |  |
| Veto HV Monitor |  |
| Veto LLD |  |
| Alpha Counter | 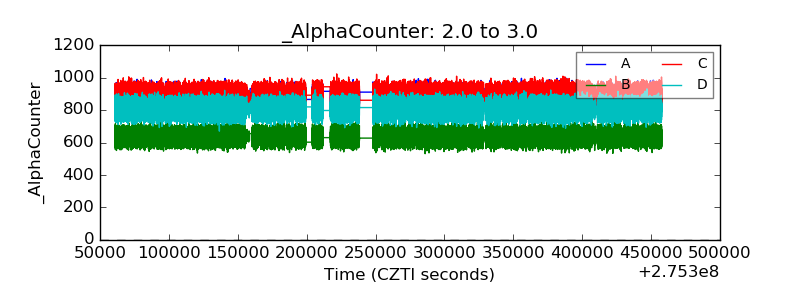 |
| _CPM_Rate |  |
| CZT Counter |  |
| +2.5 Volts monitor |  |
| +5 Volts monitor |  |
| _ROLL_ROT |  |
| _Roll_DEC |  |
| _Roll_RA | 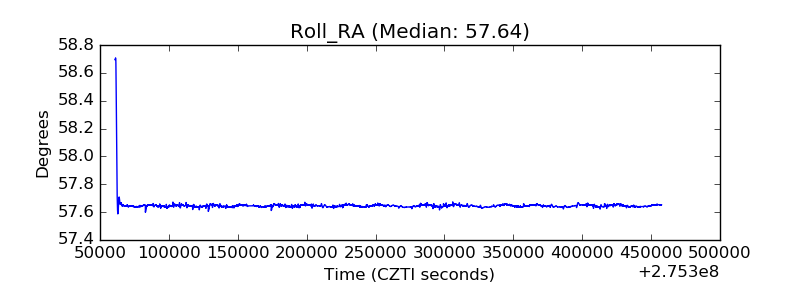 |
| Veto Counter |  |