| Param | Original file | Final file |
|---|---|---|
| Filename | modeM0/AS1T02_092T01_9000002384cztM0_level2_bc.evt | modeM0/AS1T02_092T01_9000002384cztM0_level2_quad_clean.evt |
| Size (bytes) | 3,194,438,400 | 1,069,335,360 |
| Size | 3.0 GB | 1019.8 MB |
| Events in quadrant A | 20,356,910 | 6,980,261 |
| Events in quadrant B | 21,871,973 | 6,919,173 |
| Events in quadrant C | 18,290,324 | 6,588,037 |
| Events in quadrant D | 30,716,921 | 6,356,747 |
| Mode M9 | |||
|---|---|---|---|
| Quadrant | BADHDUFLAG | Total packets | Discarded packets |
| A | 0 | 124 | 0 |
| B | 0 | 124 | 0 |
| C | 0 | 124 | 0 |
| D | 0 | 124 | 0 |
| Mode SS | |||
|---|---|---|---|
| Quadrant | BADHDUFLAG | Total packets | Discarded packets |
| A | 0 | 1646 | 0 |
| B | 0 | 1646 | 0 |
| C | 0 | 1646 | 0 |
| D | 0 | 1646 | 0 |
| Mode M0 | |||
|---|---|---|---|
| Quadrant | BADHDUFLAG | Total packets | Discarded packets |
| A | 0 | 182199 | 0 |
| B | 0 | 185634 | 0 |
| C | 0 | 173799 | 0 |
| D | 0 | 216039 | 0 |
| Quadrant | Total seconds | Saturated seconds | Saturation percentage |
|---|---|---|---|
| A | 80879 | 1869 | 2.310859% |
| B | 80879 | 1544 | 1.909025% |
| C | 80879 | 1151 | 1.423114% |
| D | 80879 | 4779 | 5.908827% |
Noise dominated data is calculated using 1-second bins in cleaned event files. If a bin has >2000 counts, and if more than 50% of those come from <1% of pixels, then it is considered to be noise-dominated and hence unusable.
| Quadrant | # 1 sec bins | Bins with >0 counts | Bins with >2000 counts | High rate bins dominated by noise | Noise dominated (total time) | Noise dominated (detector-on time) | Marked lightcurve |
|---|---|---|---|---|---|---|---|
| A | 92789 | 80882 | 47 | 47 | 0.05% | 0.06% |  |
| B | 92789 | 80883 | 78 | 78 | 0.08% | 0.10% |  |
| C | 92789 | 80882 | 3 | 3 | 0.00% | 0.00% |  |
| D | 92789 | 80882 | 995 | 995 | 1.07% | 1.23% |  |
Top three noisy pixels from each quadrant. If the there are fewer than three noisy pixels in the level2.evt file, extra rows are filled as -1
| Pixel properties | Quadrant properties | ||||||
|---|---|---|---|---|---|---|---|
| Quadrant | DetID | PixID | Counts | Sigma | Mean | Median | Sigma |
| A | 15 | 174 | 2832616 | 3077.98 | 4242 | 4174 | 918.9 |
| A | 0 | 253 | 429697 | 463.07 | 4242 | 4174 | 918.9 |
| A | 9 | 143 | 314293 | 337.48 | 4242 | 4174 | 918.9 |
| B | 5 | 65 | 1976098 | 2458.01 | 4238 | 4135 | 802.3 |
| B | 0 | 189 | 1045912 | 1298.56 | 4238 | 4135 | 802.3 |
| B | 7 | 220 | 444268 | 548.62 | 4238 | 4135 | 802.3 |
| C | 3 | 233 | 2284536 | 2427.97 | 4023 | 4005 | 939.3 |
| C | 3 | 9 | 236463 | 247.49 | 4023 | 4005 | 939.3 |
| C | 0 | 207 | 229957 | 240.56 | 4023 | 4005 | 939.3 |
| D | 1 | 52 | 12643679 | 13349.27 | 4085 | 3947 | 946.8 |
| D | 7 | 38 | 1107410 | 1165.41 | 4085 | 3947 | 946.8 |
| D | 2 | 234 | 331306 | 345.74 | 4085 | 3947 | 946.8 |
Histogram calculated using DETX and DETY for each event in the final _common_clean file
| Quadrant A |  |
 |
Quadrant B |
|---|---|---|---|
| Quadrant D |  |
 |
Quadrant C |
| Plot type | Count rate plots | Images |
|---|---|---|
| Comparison with Poisson distribution Blue bars denote a histogram of data divided into 1 sec bins. Red curve is a Poisson curve with rate = median count rate of data. |
 |
 |
| Quadrant-wise count rates Data is divided into 100 sec bins |
 |
|
| Module-wise count rates for Quadrant A Data is divided into 100 sec bins |
 |
 |
| Module-wise count rates for Quadrant B Data is divided into 100 sec bins |
 |
 |
| Module-wise count rates for Quadrant C Data is divided into 100 sec bins |
 |
 |
| Module-wise count rates for Quadrant D Data is divided into 100 sec bins |
 |
 |
| Parameter | Plot |
|---|---|
| CZT HV Monitor | 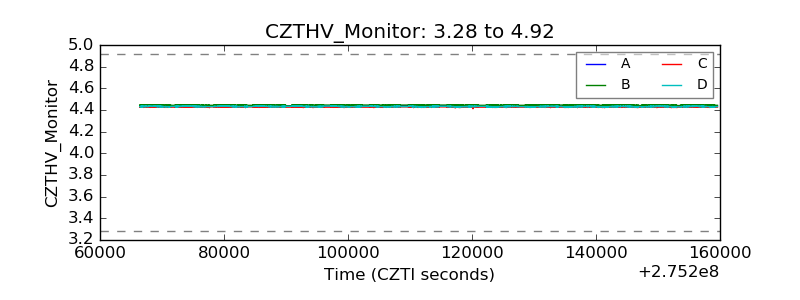 |
| D_VDD |  |
| Temperature 1 |  |
| Veto HV Monitor |  |
| Veto LLD | 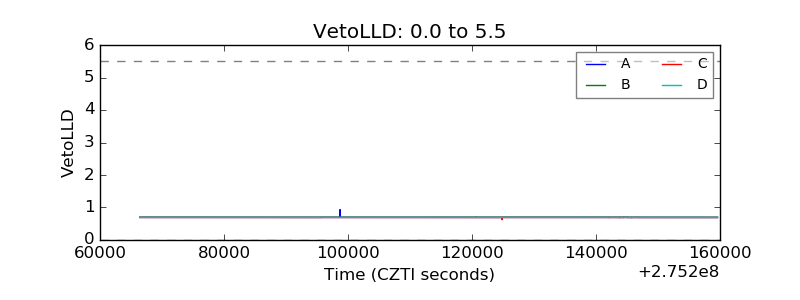 |
| Alpha Counter |  |
| _CPM_Rate | 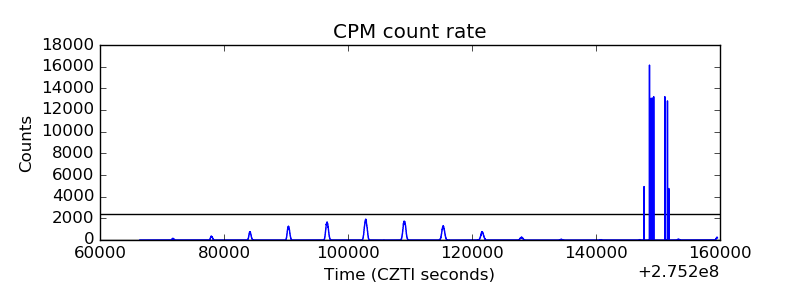 |
| CZT Counter | 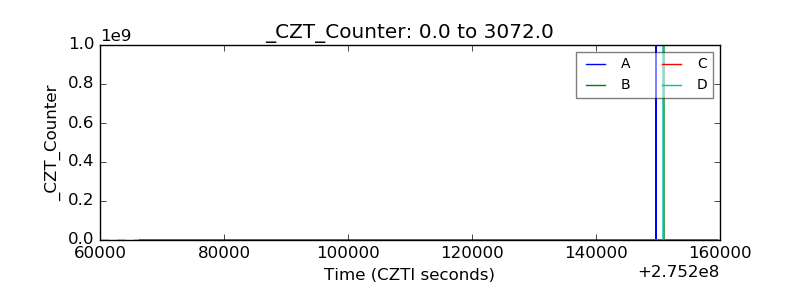 |
| +2.5 Volts monitor |  |
| +5 Volts monitor |  |
| _ROLL_ROT | 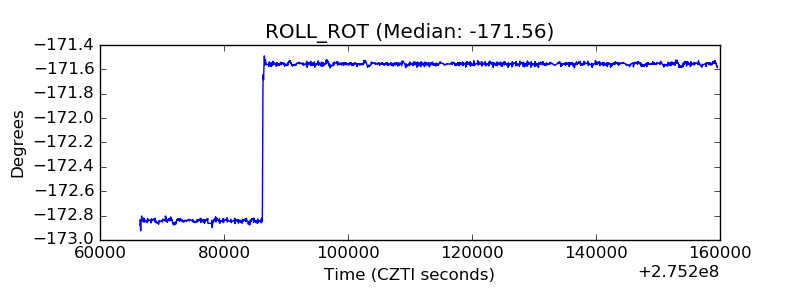 |
| _Roll_DEC |  |
| _Roll_RA |  |
| Veto Counter |  |