| Param | Original file | Final file |
|---|---|---|
| Filename | modeM0/AS1C03_015T04_9000002382cztM0_level2_bc.evt | modeM0/AS1C03_015T04_9000002382cztM0_level2_quad_clean.evt |
| Size (bytes) | 325,946,880 | 166,106,880 |
| Size | 310.8 MB | 158.4 MB |
| Events in quadrant A | 2,292,688 | 1,098,460 |
| Events in quadrant B | 2,734,963 | 1,116,449 |
| Events in quadrant C | 1,883,700 | 1,079,659 |
| Events in quadrant D | 2,289,540 | 1,062,455 |
| Mode M9 | |||
|---|---|---|---|
| Quadrant | BADHDUFLAG | Total packets | Discarded packets |
| A | 0 | 8 | 0 |
| B | 0 | 8 | 0 |
| C | 0 | 8 | 0 |
| D | 0 | 8 | 0 |
| Mode SS | |||
|---|---|---|---|
| Quadrant | BADHDUFLAG | Total packets | Discarded packets |
| A | 0 | 198 | 0 |
| B | 0 | 198 | 0 |
| C | 0 | 198 | 0 |
| D | 0 | 198 | 0 |
| Mode M0 | |||
|---|---|---|---|
| Quadrant | BADHDUFLAG | Total packets | Discarded packets |
| A | 0 | 21651 | 0 |
| B | 0 | 22362 | 0 |
| C | 0 | 19927 | 0 |
| D | 0 | 21267 | 0 |
| Quadrant | Total seconds | Saturated seconds | Saturation percentage |
|---|---|---|---|
| A | 9728 | 132 | 1.356908% |
| B | 9728 | 119 | 1.223273% |
| C | 9728 | 47 | 0.483141% |
| D | 9728 | 161 | 1.655016% |
Noise dominated data is calculated using 1-second bins in cleaned event files. If a bin has >2000 counts, and if more than 50% of those come from <1% of pixels, then it is considered to be noise-dominated and hence unusable.
| Quadrant | # 1 sec bins | Bins with >0 counts | Bins with >2000 counts | High rate bins dominated by noise | Noise dominated (total time) | Noise dominated (detector-on time) | Marked lightcurve |
|---|---|---|---|---|---|---|---|
| A | 10118 | 9727 | 0 | 0 | 0.00% | 0.00% | 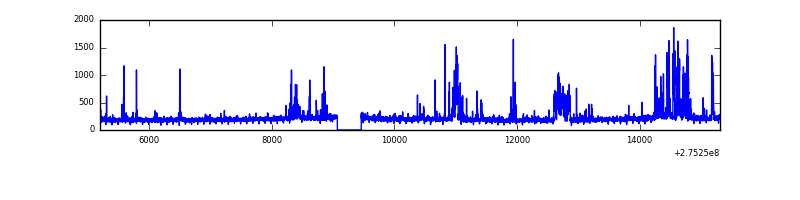 |
| B | 10118 | 9727 | 2 | 2 | 0.02% | 0.02% |  |
| C | 10118 | 9728 | 0 | 0 | 0.00% | 0.00% |  |
| D | 10118 | 9727 | 10 | 10 | 0.10% | 0.10% |  |
Top three noisy pixels from each quadrant. If the there are fewer than three noisy pixels in the level2.evt file, extra rows are filled as -1
| Pixel properties | Quadrant properties | ||||||
|---|---|---|---|---|---|---|---|
| Quadrant | DetID | PixID | Counts | Sigma | Mean | Median | Sigma |
| A | 15 | 174 | 427169 | 4062.92 | 472 | 462 | 105.0 |
| A | 9 | 143 | 19165 | 178.08 | 472 | 462 | 105.0 |
| A | 8 | 247 | 17973 | 166.73 | 472 | 462 | 105.0 |
| B | 5 | 65 | 631327 | 6723.3 | 479 | 467 | 93.8 |
| B | 0 | 189 | 59312 | 627.13 | 479 | 467 | 93.8 |
| B | 0 | 229 | 37535 | 395.05 | 479 | 467 | 93.8 |
| C | 3 | 233 | 45663 | 407.77 | 459 | 456 | 110.9 |
| C | 3 | 9 | 37262 | 332.0 | 459 | 456 | 110.9 |
| C | 0 | 207 | 10596 | 91.46 | 459 | 456 | 110.9 |
| D | 1 | 52 | 382045 | 3408.57 | 468 | 450 | 112.0 |
| D | 10 | 70 | 51990 | 460.38 | 468 | 450 | 112.0 |
| D | 2 | 234 | 43420 | 383.83 | 468 | 450 | 112.0 |
Histogram calculated using DETX and DETY for each event in the final _common_clean file
| Quadrant A |  |
 |
Quadrant B |
|---|---|---|---|
| Quadrant D |  |
 |
Quadrant C |
| Plot type | Count rate plots | Images |
|---|---|---|
| Comparison with Poisson distribution Blue bars denote a histogram of data divided into 1 sec bins. Red curve is a Poisson curve with rate = median count rate of data. |
 |
 |
| Quadrant-wise count rates Data is divided into 100 sec bins |
 |
|
| Module-wise count rates for Quadrant A Data is divided into 100 sec bins |
 |
 |
| Module-wise count rates for Quadrant B Data is divided into 100 sec bins |
 |
 |
| Module-wise count rates for Quadrant C Data is divided into 100 sec bins |
 |
 |
| Module-wise count rates for Quadrant D Data is divided into 100 sec bins |
 |
 |
| Parameter | Plot |
|---|---|
| CZT HV Monitor |  |
| D_VDD |  |
| Temperature 1 |  |
| Veto HV Monitor |  |
| Veto LLD |  |
| Alpha Counter | 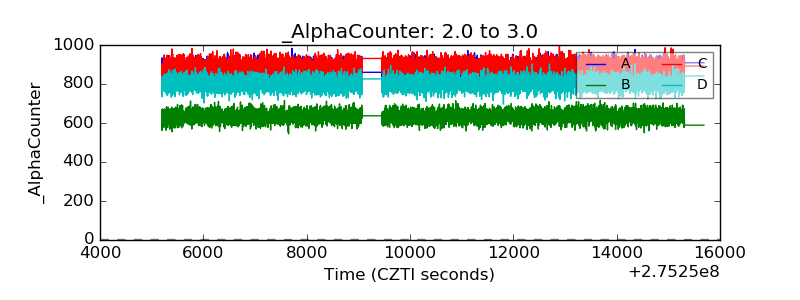 |
| _CPM_Rate |  |
| CZT Counter |  |
| +2.5 Volts monitor |  |
| +5 Volts monitor |  |
| _ROLL_ROT | 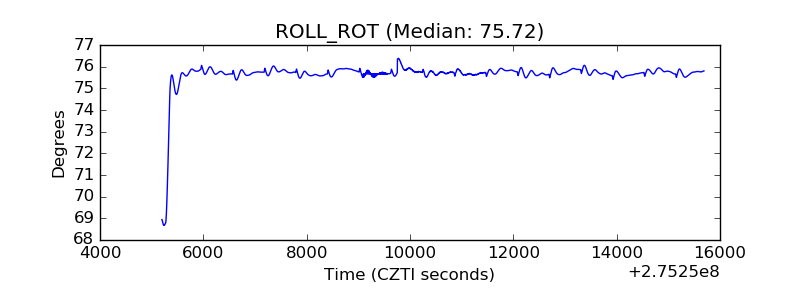 |
| _Roll_DEC |  |
| _Roll_RA |  |
| Veto Counter |  |