| Param | Original file | Final file |
|---|---|---|
| Filename | modeM0/AS1T02_094T01_9000002380cztM0_level2_bc.evt | modeM0/AS1T02_094T01_9000002380cztM0_level2_quad_clean.evt |
| Size (bytes) | 3,036,453,120 | 1,005,007,680 |
| Size | 2.8 GB | 958.5 MB |
| Events in quadrant A | 18,996,800 | 6,590,813 |
| Events in quadrant B | 20,580,767 | 6,562,019 |
| Events in quadrant C | 15,870,260 | 6,264,758 |
| Events in quadrant D | 31,512,675 | 5,988,442 |
| Mode M0 | |||
|---|---|---|---|
| Quadrant | BADHDUFLAG | Total packets | Discarded packets |
| A | 0 | 165829 | 0 |
| B | 0 | 170767 | 0 |
| C | 0 | 155721 | 0 |
| D | 0 | 208559 | 0 |
| Mode M9 | |||
|---|---|---|---|
| Quadrant | BADHDUFLAG | Total packets | Discarded packets |
| A | 0 | 120 | 0 |
| B | 0 | 120 | 0 |
| C | 0 | 120 | 0 |
| D | 0 | 120 | 0 |
| Mode SS | |||
|---|---|---|---|
| Quadrant | BADHDUFLAG | Total packets | Discarded packets |
| A | 0 | 1498 | 0 |
| B | 0 | 1498 | 0 |
| C | 0 | 1498 | 0 |
| D | 0 | 1498 | 0 |
| Quadrant | Total seconds | Saturated seconds | Saturation percentage |
|---|---|---|---|
| A | 73422 | 1183 | 1.611234% |
| B | 73422 | 1274 | 1.735175% |
| C | 73422 | 1165 | 1.586718% |
| D | 73422 | 4574 | 6.229740% |
Noise dominated data is calculated using 1-second bins in cleaned event files. If a bin has >2000 counts, and if more than 50% of those come from <1% of pixels, then it is considered to be noise-dominated and hence unusable.
| Quadrant | # 1 sec bins | Bins with >0 counts | Bins with >2000 counts | High rate bins dominated by noise | Noise dominated (total time) | Noise dominated (detector-on time) | Marked lightcurve |
|---|---|---|---|---|---|---|---|
| A | 85562 | 73410 | 17 | 17 | 0.02% | 0.02% |  |
| B | 85563 | 73411 | 8 | 8 | 0.01% | 0.01% |  |
| C | 85563 | 73411 | 30 | 30 | 0.04% | 0.04% |  |
| D | 85562 | 73410 | 669 | 669 | 0.78% | 0.91% |  |
Top three noisy pixels from each quadrant. If the there are fewer than three noisy pixels in the level2.evt file, extra rows are filled as -1
| Pixel properties | Quadrant properties | ||||||
|---|---|---|---|---|---|---|---|
| Quadrant | DetID | PixID | Counts | Sigma | Mean | Median | Sigma |
| A | 0 | 253 | 1825829 | 2157.38 | 3909 | 3850 | 844.5 |
| A | 15 | 174 | 1701994 | 2010.75 | 3909 | 3850 | 844.5 |
| A | 8 | 247 | 187915 | 217.95 | 3909 | 3850 | 844.5 |
| B | 5 | 65 | 2067898 | 2799.79 | 3908 | 3821 | 737.2 |
| B | 0 | 189 | 942678 | 1273.5 | 3908 | 3821 | 737.2 |
| B | 7 | 220 | 610374 | 822.75 | 3908 | 3821 | 737.2 |
| C | 9 | 236 | 605445 | 691.49 | 3718 | 3710 | 870.2 |
| C | 3 | 233 | 377653 | 429.72 | 3718 | 3710 | 870.2 |
| C | 3 | 9 | 352264 | 400.54 | 3718 | 3710 | 870.2 |
| D | 1 | 52 | 10529826 | 12016.93 | 3760 | 3633 | 875.9 |
| D | 5 | 222 | 3595638 | 4100.71 | 3760 | 3633 | 875.9 |
| D | 7 | 38 | 1713373 | 1951.88 | 3760 | 3633 | 875.9 |
Histogram calculated using DETX and DETY for each event in the final _common_clean file
| Quadrant A |  |
 |
Quadrant B |
|---|---|---|---|
| Quadrant D |  |
 |
Quadrant C |
| Plot type | Count rate plots | Images |
|---|---|---|
| Comparison with Poisson distribution Blue bars denote a histogram of data divided into 1 sec bins. Red curve is a Poisson curve with rate = median count rate of data. |
 |
 |
| Quadrant-wise count rates Data is divided into 100 sec bins |
 |
|
| Module-wise count rates for Quadrant A Data is divided into 100 sec bins |
 |
 |
| Module-wise count rates for Quadrant B Data is divided into 100 sec bins |
 |
 |
| Module-wise count rates for Quadrant C Data is divided into 100 sec bins |
 |
 |
| Module-wise count rates for Quadrant D Data is divided into 100 sec bins |
 |
 |
| Parameter | Plot |
|---|---|
| CZT HV Monitor |  |
| D_VDD |  |
| Temperature 1 |  |
| Veto HV Monitor |  |
| Veto LLD |  |
| Alpha Counter |  |
| _CPM_Rate |  |
| CZT Counter |  |
| +2.5 Volts monitor | 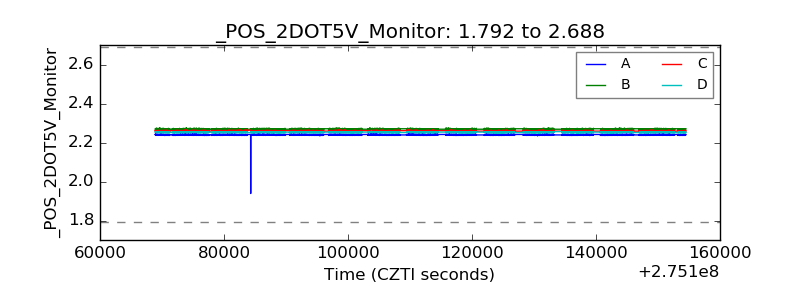 |
| +5 Volts monitor |  |
| _ROLL_ROT |  |
| _Roll_DEC |  |
| _Roll_RA |  |
| Veto Counter |  |