| Param | Original file | Final file |
|---|---|---|
| Filename | modeM0/AS1T02_110T01_9000002376cztM0_level2_bc.evt | modeM0/AS1T02_110T01_9000002376cztM0_level2_quad_clean.evt |
| Size (bytes) | 3,238,796,160 | 1,189,967,040 |
| Size | 3.0 GB | 1.1 GB |
| Events in quadrant A | 20,137,910 | 7,749,030 |
| Events in quadrant B | 23,407,806 | 7,671,958 |
| Events in quadrant C | 19,377,662 | 7,318,922 |
| Events in quadrant D | 28,913,964 | 7,017,143 |
| Mode SS | |||
|---|---|---|---|
| Quadrant | BADHDUFLAG | Total packets | Discarded packets |
| A | 0 | 1868 | 0 |
| B | 0 | 1868 | 0 |
| C | 0 | 1868 | 0 |
| D | 0 | 1868 | 0 |
| Mode M9 | |||
|---|---|---|---|
| Quadrant | BADHDUFLAG | Total packets | Discarded packets |
| A | 0 | 160 | 0 |
| B | 0 | 160 | 0 |
| C | 0 | 160 | 0 |
| D | 0 | 160 | 0 |
| Mode M0 | |||
|---|---|---|---|
| Quadrant | BADHDUFLAG | Total packets | Discarded packets |
| A | 0 | 194956 | 0 |
| B | 0 | 206572 | 0 |
| C | 0 | 193046 | 0 |
| D | 0 | 236476 | 0 |
| Quadrant | Total seconds | Saturated seconds | Saturation percentage |
|---|---|---|---|
| A | 91694 | 1278 | 1.393766% |
| B | 91694 | 1537 | 1.676227% |
| C | 91694 | 1273 | 1.388313% |
| D | 91694 | 5765 | 6.287216% |
Noise dominated data is calculated using 1-second bins in cleaned event files. If a bin has >2000 counts, and if more than 50% of those come from <1% of pixels, then it is considered to be noise-dominated and hence unusable.
| Quadrant | # 1 sec bins | Bins with >0 counts | Bins with >2000 counts | High rate bins dominated by noise | Noise dominated (total time) | Noise dominated (detector-on time) | Marked lightcurve |
|---|---|---|---|---|---|---|---|
| A | 107620 | 91682 | 50 | 50 | 0.05% | 0.05% |  |
| B | 107620 | 91682 | 23 | 23 | 0.02% | 0.03% |  |
| C | 107620 | 91680 | 3 | 3 | 0.00% | 0.00% |  |
| D | 107620 | 91684 | 97 | 97 | 0.09% | 0.11% |  |
Top three noisy pixels from each quadrant. If the there are fewer than three noisy pixels in the level2.evt file, extra rows are filled as -1
| Pixel properties | Quadrant properties | ||||||
|---|---|---|---|---|---|---|---|
| Quadrant | DetID | PixID | Counts | Sigma | Mean | Median | Sigma |
| A | 15 | 239 | 741294 | 712.68 | 4795 | 4711 | 1033.5 |
| A | 12 | 96 | 445502 | 426.49 | 4795 | 4711 | 1033.5 |
| A | 9 | 143 | 248833 | 236.2 | 4795 | 4711 | 1033.5 |
| B | 0 | 189 | 1153714 | 1279.27 | 4792 | 4671 | 898.2 |
| B | 7 | 220 | 935212 | 1036.01 | 4792 | 4671 | 898.2 |
| B | 4 | 173 | 674895 | 746.19 | 4792 | 4671 | 898.2 |
| C | 3 | 233 | 1504376 | 1415.34 | 4567 | 4543 | 1059.7 |
| C | 0 | 207 | 148750 | 136.08 | 4567 | 4543 | 1059.7 |
| C | 7 | 247 | 69904 | 61.68 | 4567 | 4543 | 1059.7 |
| D | 7 | 38 | 6301343 | 5823.8 | 4615 | 4444 | 1081.2 |
| D | 12 | 218 | 2877504 | 2657.2 | 4615 | 4444 | 1081.2 |
| D | 5 | 222 | 411586 | 376.55 | 4615 | 4444 | 1081.2 |
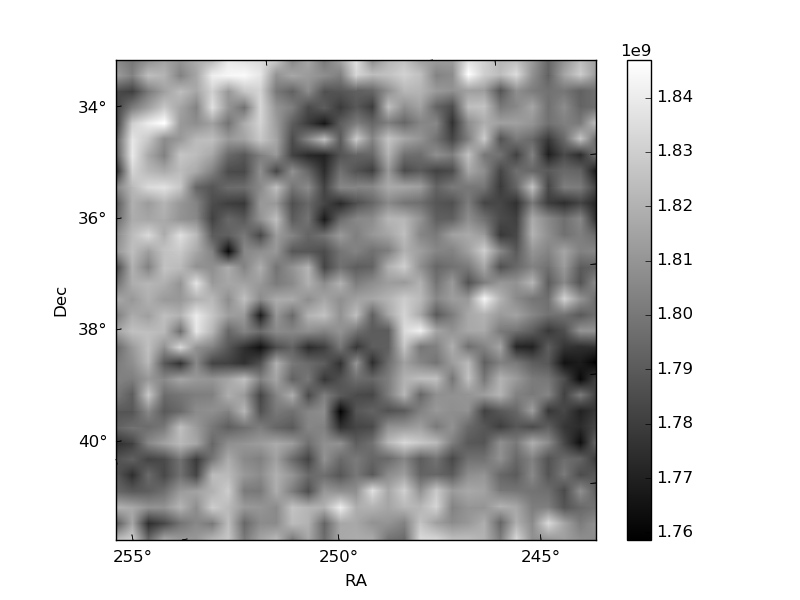
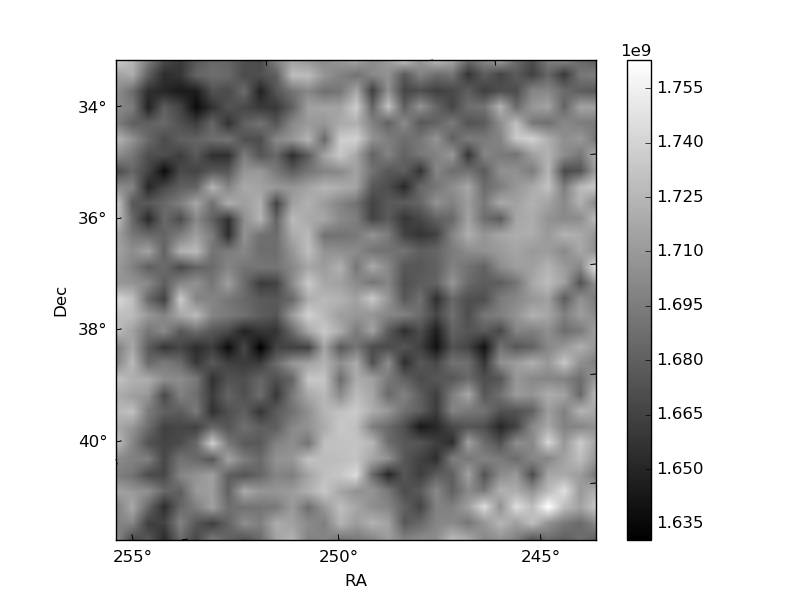
Histogram calculated using DETX and DETY for each event in the final _common_clean file
| Quadrant A |  |
 |
Quadrant B |
|---|---|---|---|
| Quadrant D |  |
 |
Quadrant C |
| Plot type | Count rate plots | Images |
|---|---|---|
| Comparison with Poisson distribution Blue bars denote a histogram of data divided into 1 sec bins. Red curve is a Poisson curve with rate = median count rate of data. |
 |
 |
| Quadrant-wise count rates Data is divided into 100 sec bins |
 |
|
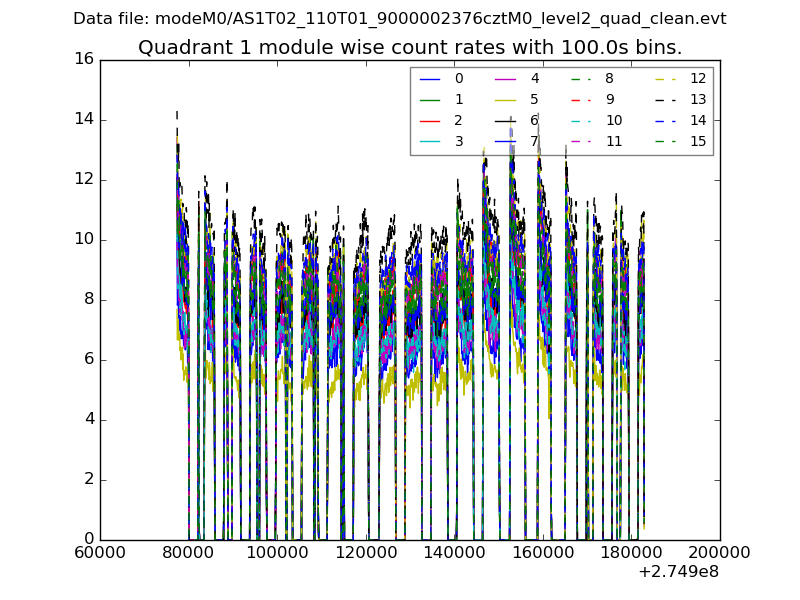
| Module-wise count rates for Quadrant A Data is divided into 100 sec bins |
 |
 |
| Module-wise count rates for Quadrant B Data is divided into 100 sec bins |
 |
 |
| Module-wise count rates for Quadrant C Data is divided into 100 sec bins |
 |
 |
| Module-wise count rates for Quadrant D Data is divided into 100 sec bins |
 |
 |
| Parameter | Plot |
|---|---|
| CZT HV Monitor |  |
| D_VDD |  |
| Temperature 1 | 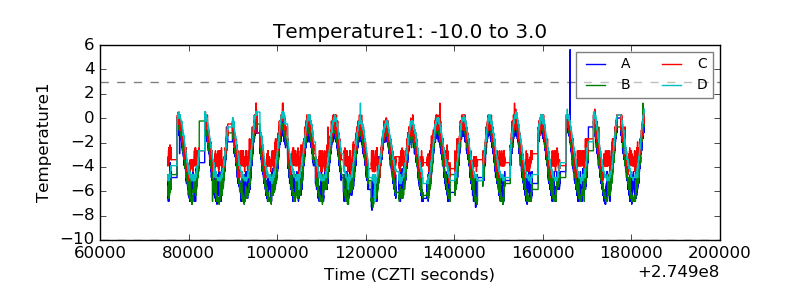 |
| Veto HV Monitor | 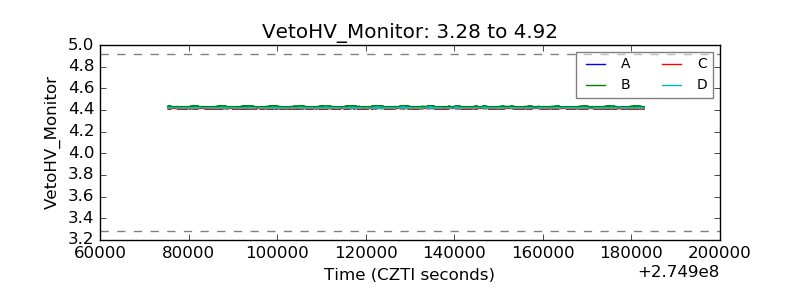 |
| Veto LLD |  |
| Alpha Counter | 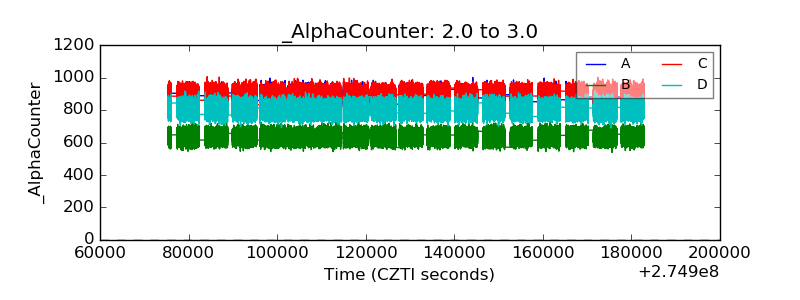 |
| _CPM_Rate |  |
| CZT Counter | 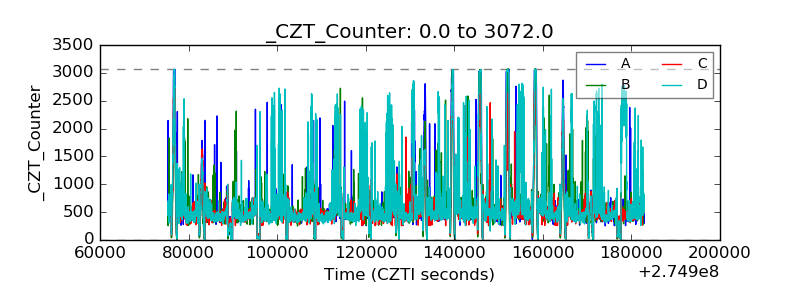 |
| +2.5 Volts monitor |  |
| +5 Volts monitor | 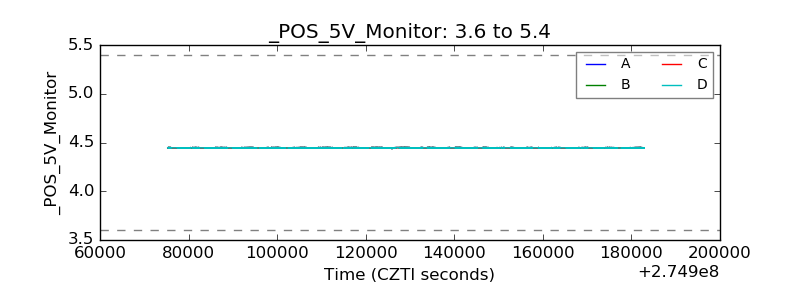 |
| _ROLL_ROT |  |
| _Roll_DEC |  |
| _Roll_RA |  |
| Veto Counter |  |