| Param | Original file | Final file |
|---|---|---|
| Filename | modeM0/AS1A04_230T01_9000002374cztM0_level2_bc.evt | modeM0/AS1A04_230T01_9000002374cztM0_level2_quad_clean.evt |
| Size (bytes) | 3,278,073,600 | 1,242,233,280 |
| Size | 3.1 GB | 1.2 GB |
| Events in quadrant A | 23,082,647 | 8,123,414 |
| Events in quadrant B | 22,713,951 | 8,080,853 |
| Events in quadrant C | 18,731,561 | 7,725,888 |
| Events in quadrant D | 28,626,808 | 7,536,824 |
| Mode SS | |||
|---|---|---|---|
| Quadrant | BADHDUFLAG | Total packets | Discarded packets |
| A | 0 | 1830 | 0 |
| B | 0 | 1830 | 0 |
| C | 0 | 1830 | 0 |
| D | 0 | 1830 | 0 |
| Mode M9 | |||
|---|---|---|---|
| Quadrant | BADHDUFLAG | Total packets | Discarded packets |
| A | 0 | 160 | 0 |
| B | 0 | 160 | 0 |
| C | 0 | 160 | 0 |
| D | 0 | 160 | 0 |
| Mode M0 | |||
|---|---|---|---|
| Quadrant | BADHDUFLAG | Total packets | Discarded packets |
| A | 0 | 199125 | 0 |
| B | 0 | 201644 | 0 |
| C | 0 | 187841 | 0 |
| D | 0 | 219386 | 0 |
| Quadrant | Total seconds | Saturated seconds | Saturation percentage |
|---|---|---|---|
| A | 89875 | 1201 | 1.336300% |
| B | 89875 | 1599 | 1.779138% |
| C | 89875 | 1167 | 1.298470% |
| D | 89875 | 3074 | 3.420306% |
Noise dominated data is calculated using 1-second bins in cleaned event files. If a bin has >2000 counts, and if more than 50% of those come from <1% of pixels, then it is considered to be noise-dominated and hence unusable.
| Quadrant | # 1 sec bins | Bins with >0 counts | Bins with >2000 counts | High rate bins dominated by noise | Noise dominated (total time) | Noise dominated (detector-on time) | Marked lightcurve |
|---|---|---|---|---|---|---|---|
| A | 105891 | 89865 | 21 | 21 | 0.02% | 0.02% | 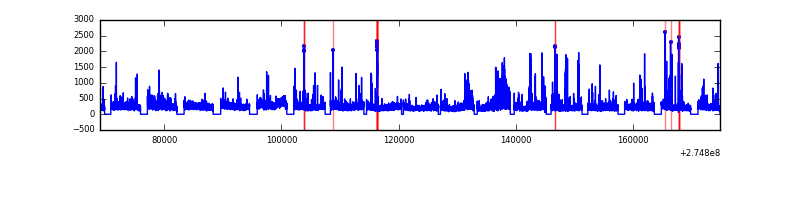 |
| B | 105891 | 89866 | 15 | 15 | 0.01% | 0.02% |  |
| C | 105891 | 89863 | 2 | 2 | 0.00% | 0.00% |  |
| D | 105891 | 89862 | 622 | 622 | 0.59% | 0.69% |  |
Top three noisy pixels from each quadrant. If the there are fewer than three noisy pixels in the level2.evt file, extra rows are filled as -1
| Pixel properties | Quadrant properties | ||||||
|---|---|---|---|---|---|---|---|
| Quadrant | DetID | PixID | Counts | Sigma | Mean | Median | Sigma |
| A | 3 | 80 | 3095132 | 2963.72 | 4816 | 4734 | 1042.7 |
| A | 13 | 210 | 451752 | 428.69 | 4816 | 4734 | 1042.7 |
| A | 15 | 174 | 391930 | 371.32 | 4816 | 4734 | 1042.7 |
| B | 7 | 220 | 956996 | 1062.98 | 4808 | 4702 | 895.9 |
| B | 0 | 189 | 747482 | 829.11 | 4808 | 4702 | 895.9 |
| B | 0 | 190 | 367702 | 405.19 | 4808 | 4702 | 895.9 |
| C | 3 | 233 | 537115 | 494.82 | 4592 | 4584 | 1076.2 |
| C | 0 | 207 | 368604 | 338.24 | 4592 | 4584 | 1076.2 |
| C | 7 | 247 | 56959 | 48.67 | 4592 | 4584 | 1076.2 |
| D | 1 | 52 | 6180888 | 5600.92 | 4697 | 4531 | 1102.7 |
| D | 12 | 218 | 1891161 | 1710.86 | 4697 | 4531 | 1102.7 |
| D | 13 | 232 | 669372 | 602.9 | 4697 | 4531 | 1102.7 |
Histogram calculated using DETX and DETY for each event in the final _common_clean file
| Quadrant A |  |
 |
Quadrant B |
|---|---|---|---|
| Quadrant D |  |
 |
Quadrant C |
| Plot type | Count rate plots | Images |
|---|---|---|
| Comparison with Poisson distribution Blue bars denote a histogram of data divided into 1 sec bins. Red curve is a Poisson curve with rate = median count rate of data. |
 |
 |
| Quadrant-wise count rates Data is divided into 100 sec bins |
 |
|
| Module-wise count rates for Quadrant A Data is divided into 100 sec bins |
 |
 |
| Module-wise count rates for Quadrant B Data is divided into 100 sec bins |
 |
 |
| Module-wise count rates for Quadrant C Data is divided into 100 sec bins |
 |
 |
| Module-wise count rates for Quadrant D Data is divided into 100 sec bins |
 |
 |
| Parameter | Plot |
|---|---|
| CZT HV Monitor | 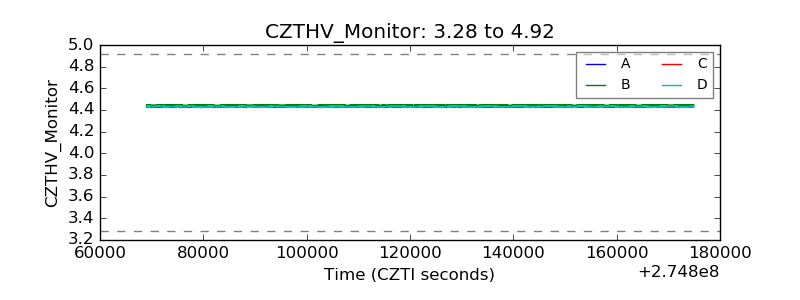 |
| D_VDD |  |
| Temperature 1 |  |
| Veto HV Monitor |  |
| Veto LLD |  |
| Alpha Counter |  |
| _CPM_Rate |  |
| CZT Counter |  |
| +2.5 Volts monitor |  |
| +5 Volts monitor |  |
| _ROLL_ROT |  |
| _Roll_DEC |  |
| _Roll_RA |  |
| Veto Counter |  |