| Param | Original file | Final file |
|---|---|---|
| Filename | modeM0/AS1G08_012T01_9000002370cztM0_level2_bc.evt | modeM0/AS1G08_012T01_9000002370cztM0_level2_quad_clean.evt |
| Size (bytes) | 4,298,590,080 | 1,783,572,480 |
| Size | 4.0 GB | 1.7 GB |
| Events in quadrant A | 30,243,625 | 11,211,229 |
| Events in quadrant B | 29,367,834 | 11,424,362 |
| Events in quadrant C | 29,457,384 | 11,106,079 |
| Events in quadrant D | 31,864,723 | 10,983,196 |
| Mode M0 | |||
|---|---|---|---|
| Quadrant | BADHDUFLAG | Total packets | Discarded packets |
| A | 0 | 288995 | 0 |
| B | 0 | 287401 | 0 |
| C | 0 | 290684 | 0 |
| D | 0 | 295076 | 0 |
| Mode SS | |||
|---|---|---|---|
| Quadrant | BADHDUFLAG | Total packets | Discarded packets |
| A | 0 | 2762 | 0 |
| B | 0 | 2762 | 0 |
| C | 0 | 2762 | 0 |
| D | 0 | 2762 | 0 |
| Mode M9 | |||
|---|---|---|---|
| Quadrant | BADHDUFLAG | Total packets | Discarded packets |
| A | 0 | 220 | 0 |
| B | 0 | 220 | 0 |
| C | 0 | 220 | 0 |
| D | 0 | 221 | 0 |
| Quadrant | Total seconds | Saturated seconds | Saturation percentage |
|---|---|---|---|
| A | 135742 | 1500 | 1.105037% |
| B | 135742 | 1614 | 1.189020% |
| C | 135742 | 2379 | 1.752589% |
| D | 135742 | 1552 | 1.143345% |
Noise dominated data is calculated using 1-second bins in cleaned event files. If a bin has >2000 counts, and if more than 50% of those come from <1% of pixels, then it is considered to be noise-dominated and hence unusable.
| Quadrant | # 1 sec bins | Bins with >0 counts | Bins with >2000 counts | High rate bins dominated by noise | Noise dominated (total time) | Noise dominated (detector-on time) | Marked lightcurve |
|---|---|---|---|---|---|---|---|
| A | 161721 | 135727 | 32 | 32 | 0.02% | 0.02% |  |
| B | 161720 | 135725 | 2 | 2 | 0.00% | 0.00% |  |
| C | 161720 | 135729 | 34 | 34 | 0.02% | 0.03% |  |
| D | 161720 | 135730 | 133 | 133 | 0.08% | 0.10% |  |
Top three noisy pixels from each quadrant. If the there are fewer than three noisy pixels in the level2.evt file, extra rows are filled as -1
| Pixel properties | Quadrant properties | ||||||
|---|---|---|---|---|---|---|---|
| Quadrant | DetID | PixID | Counts | Sigma | Mean | Median | Sigma |
| A | 3 | 80 | 1833040 | 1183.33 | 7206 | 7075 | 1543.1 |
| A | 15 | 223 | 342886 | 217.62 | 7206 | 7075 | 1543.1 |
| A | 9 | 143 | 125468 | 76.73 | 7206 | 7075 | 1543.1 |
| B | 0 | 230 | 313567 | 225.74 | 7303 | 7120 | 1357.5 |
| B | 0 | 229 | 211251 | 150.37 | 7303 | 7120 | 1357.5 |
| B | 4 | 48 | 192293 | 136.4 | 7303 | 7120 | 1357.5 |
| C | 3 | 233 | 1315851 | 812.74 | 7043 | 7017 | 1610.4 |
| C | 9 | 236 | 689696 | 423.92 | 7043 | 7017 | 1610.4 |
| C | 15 | 48 | 124231 | 72.79 | 7043 | 7017 | 1610.4 |
| D | 1 | 52 | 1617136 | 984.15 | 7201 | 6964 | 1636.1 |
| D | 13 | 232 | 1072846 | 651.47 | 7201 | 6964 | 1636.1 |
| D | 2 | 152 | 730890 | 442.47 | 7201 | 6964 | 1636.1 |
Histogram calculated using DETX and DETY for each event in the final _common_clean file
| Quadrant A |  |
 |
Quadrant B |
|---|---|---|---|
| Quadrant D |  |
 |
Quadrant C |
| Plot type | Count rate plots | Images |
|---|---|---|
| Comparison with Poisson distribution Blue bars denote a histogram of data divided into 1 sec bins. Red curve is a Poisson curve with rate = median count rate of data. |
 |
 |
| Quadrant-wise count rates Data is divided into 100 sec bins |
 |
|
| Module-wise count rates for Quadrant A Data is divided into 100 sec bins |
 |
 |
| Module-wise count rates for Quadrant B Data is divided into 100 sec bins |
 |
 |
| Module-wise count rates for Quadrant C Data is divided into 100 sec bins |
 |
 |
| Module-wise count rates for Quadrant D Data is divided into 100 sec bins |
 |
 |
| Parameter | Plot |
|---|---|
| CZT HV Monitor | 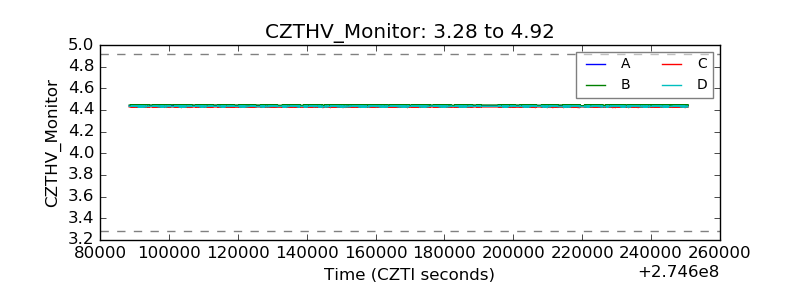 |
| D_VDD |  |
| Temperature 1 |  |
| Veto HV Monitor |  |
| Veto LLD | 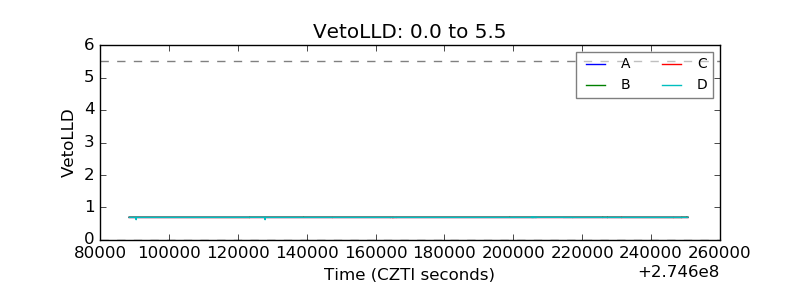 |
| Alpha Counter |  |
| _CPM_Rate |  |
| CZT Counter |  |
| +2.5 Volts monitor |  |
| +5 Volts monitor | 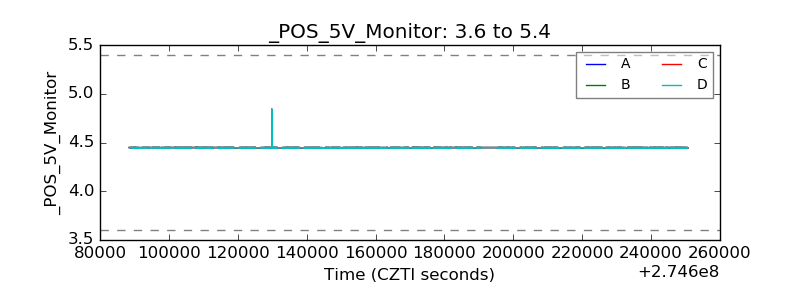 |
| _ROLL_ROT |  |
| _Roll_DEC |  |
| _Roll_RA |  |
| Veto Counter |  |