| Param | Original file | Final file |
|---|---|---|
| Filename | modeM0/AS1T02_091T01_9000002368cztM0_level2_bc.evt | modeM0/AS1T02_091T01_9000002368cztM0_level2_quad_clean.evt |
| Size (bytes) | 2,681,827,200 | 1,120,608,000 |
| Size | 2.5 GB | 1.0 GB |
| Events in quadrant A | 18,075,909 | 7,186,843 |
| Events in quadrant B | 20,575,526 | 7,270,243 |
| Events in quadrant C | 18,040,980 | 7,029,697 |
| Events in quadrant D | 18,997,767 | 6,896,033 |
| Mode SS | |||
|---|---|---|---|
| Quadrant | BADHDUFLAG | Total packets | Discarded packets |
| A | 0 | 1648 | 0 |
| B | 0 | 1648 | 0 |
| C | 0 | 1648 | 0 |
| D | 0 | 1648 | 0 |
| Mode M9 | |||
|---|---|---|---|
| Quadrant | BADHDUFLAG | Total packets | Discarded packets |
| A | 0 | 127 | 0 |
| B | 0 | 127 | 0 |
| C | 0 | 127 | 0 |
| D | 0 | 127 | 0 |
| Mode M0 | |||
|---|---|---|---|
| Quadrant | BADHDUFLAG | Total packets | Discarded packets |
| A | 0 | 171328 | 0 |
| B | 0 | 181884 | 0 |
| C | 0 | 173328 | 0 |
| D | 0 | 173142 | 0 |
| Quadrant | Total seconds | Saturated seconds | Saturation percentage |
|---|---|---|---|
| A | 81130 | 981 | 1.209170% |
| B | 81130 | 1674 | 2.063355% |
| C | 81130 | 1320 | 1.627018% |
| D | 81130 | 816 | 1.005793% |
Noise dominated data is calculated using 1-second bins in cleaned event files. If a bin has >2000 counts, and if more than 50% of those come from <1% of pixels, then it is considered to be noise-dominated and hence unusable.
| Quadrant | # 1 sec bins | Bins with >0 counts | Bins with >2000 counts | High rate bins dominated by noise | Noise dominated (total time) | Noise dominated (detector-on time) | Marked lightcurve |
|---|---|---|---|---|---|---|---|
| A | 93541 | 81119 | 27 | 27 | 0.03% | 0.03% | 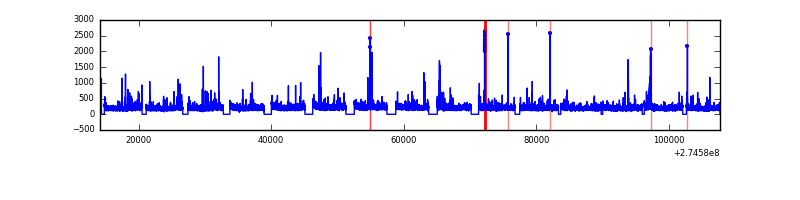 |
| B | 93541 | 81122 | 35 | 35 | 0.04% | 0.04% |  |
| C | 93541 | 81123 | 5 | 5 | 0.01% | 0.01% |  |
| D | 93541 | 81121 | 22 | 22 | 0.02% | 0.03% | 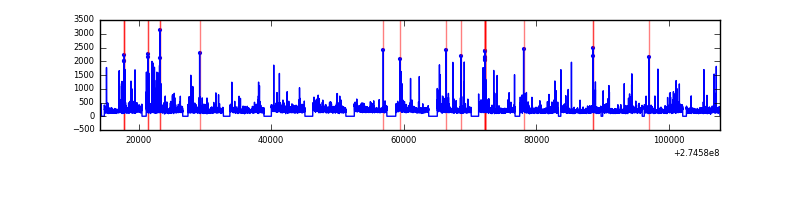 |
Top three noisy pixels from each quadrant. If the there are fewer than three noisy pixels in the level2.evt file, extra rows are filled as -1
| Pixel properties | Quadrant properties | ||||||
|---|---|---|---|---|---|---|---|
| Quadrant | DetID | PixID | Counts | Sigma | Mean | Median | Sigma |
| A | 12 | 96 | 131816 | 127.37 | 4551 | 4471 | 999.8 |
| A | 9 | 143 | 130869 | 126.42 | 4551 | 4471 | 999.8 |
| A | 15 | 174 | 104523 | 100.07 | 4551 | 4471 | 999.8 |
| B | 15 | 222 | 695188 | 783.63 | 4573 | 4480 | 881.4 |
| B | 4 | 173 | 538057 | 605.36 | 4573 | 4480 | 881.4 |
| B | 7 | 220 | 442159 | 496.56 | 4573 | 4480 | 881.4 |
| C | 3 | 233 | 1007700 | 965.34 | 4398 | 4403 | 1039.3 |
| C | 10 | 22 | 69406 | 62.54 | 4398 | 4403 | 1039.3 |
| C | 7 | 247 | 34245 | 28.71 | 4398 | 4403 | 1039.3 |
| D | 2 | 152 | 776933 | 735.17 | 4501 | 4364 | 1050.9 |
| D | 2 | 14 | 436792 | 411.5 | 4501 | 4364 | 1050.9 |
| D | 2 | 234 | 308181 | 289.11 | 4501 | 4364 | 1050.9 |
Histogram calculated using DETX and DETY for each event in the final _common_clean file
| Quadrant A |  |
 |
Quadrant B |
|---|---|---|---|
| Quadrant D |  |
 |
Quadrant C |
| Plot type | Count rate plots | Images |
|---|---|---|
| Comparison with Poisson distribution Blue bars denote a histogram of data divided into 1 sec bins. Red curve is a Poisson curve with rate = median count rate of data. |
 |
 |
| Quadrant-wise count rates Data is divided into 100 sec bins |
 |
|
| Module-wise count rates for Quadrant A Data is divided into 100 sec bins |
 |
 |
| Module-wise count rates for Quadrant B Data is divided into 100 sec bins |
 |
 |
| Module-wise count rates for Quadrant C Data is divided into 100 sec bins |
 |
 |
| Module-wise count rates for Quadrant D Data is divided into 100 sec bins |
 |
 |
| Parameter | Plot |
|---|---|
| CZT HV Monitor |  |
| D_VDD |  |
| Temperature 1 |  |
| Veto HV Monitor |  |
| Veto LLD |  |
| Alpha Counter |  |
| _CPM_Rate |  |
| CZT Counter |  |
| +2.5 Volts monitor |  |
| +5 Volts monitor |  |
| _ROLL_ROT |  |
| _Roll_DEC |  |
| _Roll_RA | 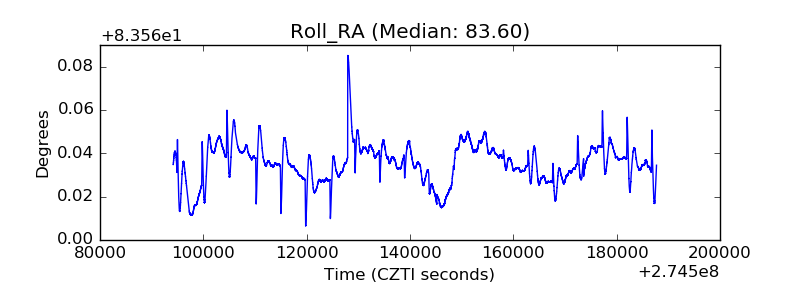 |
| Veto Counter |  |