| Param | Original file | Final file |
|---|---|---|
| Filename | modeM0/AS1T02_090T01_9000002364cztM0_level2_bc.evt | modeM0/AS1T02_090T01_9000002364cztM0_level2_quad_clean.evt |
| Size (bytes) | 1,588,792,320 | 649,094,400 |
| Size | 1.5 GB | 619.0 MB |
| Events in quadrant A | 10,428,249 | 4,234,626 |
| Events in quadrant B | 11,459,040 | 4,260,138 |
| Events in quadrant C | 10,705,509 | 4,117,219 |
| Events in quadrant D | 12,516,539 | 4,023,203 |
| Mode M0 | |||
|---|---|---|---|
| Quadrant | BADHDUFLAG | Total packets | Discarded packets |
| A | 0 | 94925 | 0 |
| B | 0 | 99501 | 0 |
| C | 0 | 96851 | 0 |
| D | 0 | 102515 | 0 |
| Mode M9 | |||
|---|---|---|---|
| Quadrant | BADHDUFLAG | Total packets | Discarded packets |
| A | 0 | 97 | 0 |
| B | 0 | 97 | 0 |
| C | 0 | 97 | 0 |
| D | 0 | 97 | 0 |
| Mode SS | |||
|---|---|---|---|
| Quadrant | BADHDUFLAG | Total packets | Discarded packets |
| A | 0 | 898 | 0 |
| B | 0 | 898 | 0 |
| C | 0 | 898 | 0 |
| D | 0 | 898 | 0 |
| Quadrant | Total seconds | Saturated seconds | Saturation percentage |
|---|---|---|---|
| A | 44093 | 630 | 1.428798% |
| B | 44093 | 916 | 2.077427% |
| C | 44093 | 851 | 1.930012% |
| D | 44093 | 1130 | 2.562765% |
Noise dominated data is calculated using 1-second bins in cleaned event files. If a bin has >2000 counts, and if more than 50% of those come from <1% of pixels, then it is considered to be noise-dominated and hence unusable.
| Quadrant | # 1 sec bins | Bins with >0 counts | Bins with >2000 counts | High rate bins dominated by noise | Noise dominated (total time) | Noise dominated (detector-on time) | Marked lightcurve |
|---|---|---|---|---|---|---|---|
| A | 53724 | 44089 | 4 | 4 | 0.01% | 0.01% |  |
| B | 53724 | 44089 | 13 | 13 | 0.02% | 0.03% | 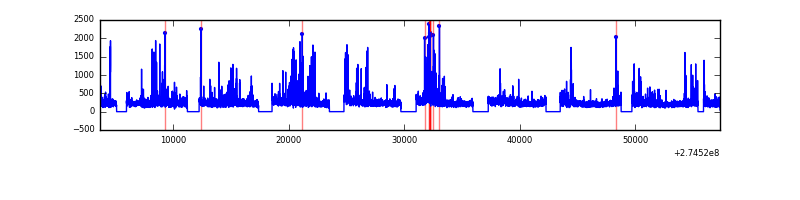 |
| C | 53724 | 44089 | 2 | 2 | 0.00% | 0.00% |  |
| D | 53724 | 44088 | 69 | 69 | 0.13% | 0.16% |  |
Top three noisy pixels from each quadrant. If the there are fewer than three noisy pixels in the level2.evt file, extra rows are filled as -1
| Pixel properties | Quadrant properties | ||||||
|---|---|---|---|---|---|---|---|
| Quadrant | DetID | PixID | Counts | Sigma | Mean | Median | Sigma |
| A | 15 | 157 | 148776 | 253.44 | 2597 | 2542 | 577.0 |
| A | 14 | 235 | 99259 | 167.62 | 2597 | 2542 | 577.0 |
| A | 10 | 253 | 63555 | 105.74 | 2597 | 2542 | 577.0 |
| B | 7 | 220 | 324610 | 652.78 | 2610 | 2562 | 493.3 |
| B | 5 | 65 | 294343 | 591.43 | 2610 | 2562 | 493.3 |
| B | 10 | 245 | 148850 | 296.52 | 2610 | 2562 | 493.3 |
| C | 3 | 233 | 981438 | 1652.92 | 2510 | 2527 | 592.2 |
| C | 0 | 207 | 33876 | 52.93 | 2510 | 2527 | 592.2 |
| C | 9 | 54 | 22282 | 33.36 | 2510 | 2527 | 592.2 |
| D | 12 | 218 | 1994201 | 3273.82 | 2558 | 2470 | 608.4 |
| D | 2 | 152 | 211434 | 343.48 | 2558 | 2470 | 608.4 |
| D | 2 | 234 | 171342 | 277.58 | 2558 | 2470 | 608.4 |
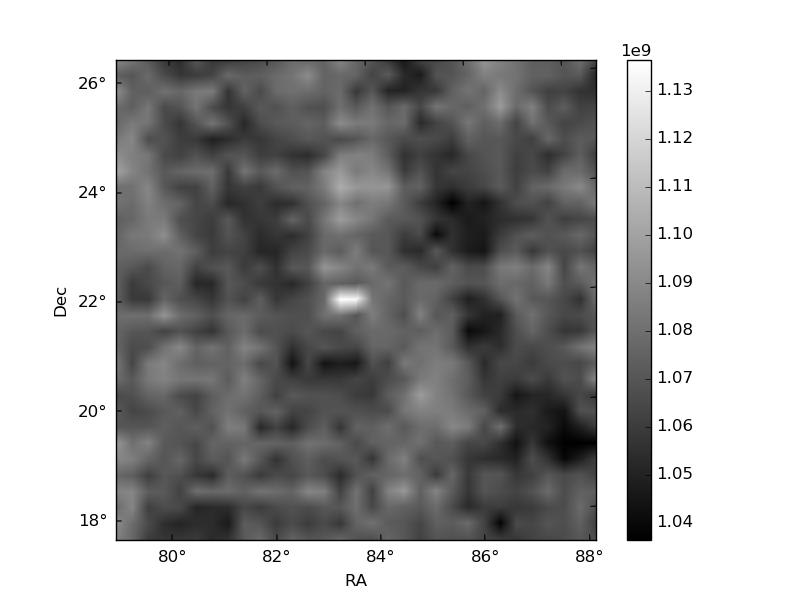
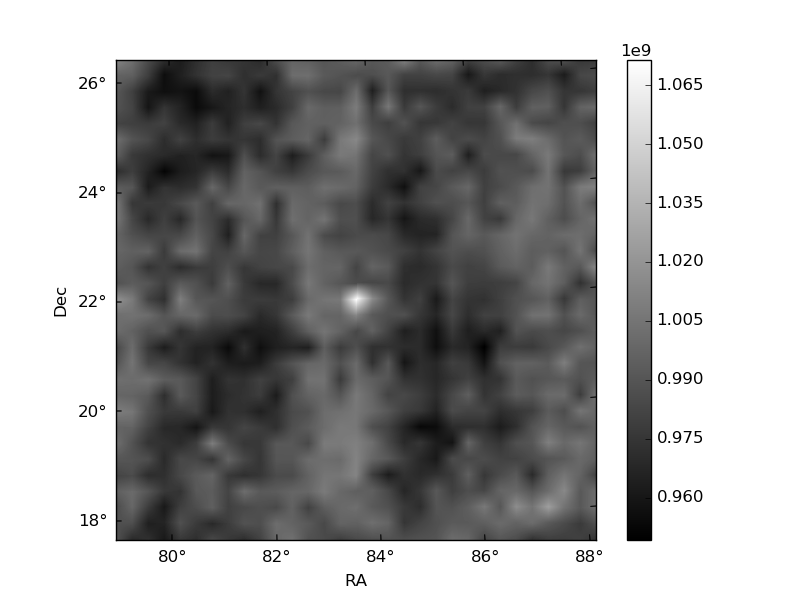
Histogram calculated using DETX and DETY for each event in the final _common_clean file
| Quadrant A | 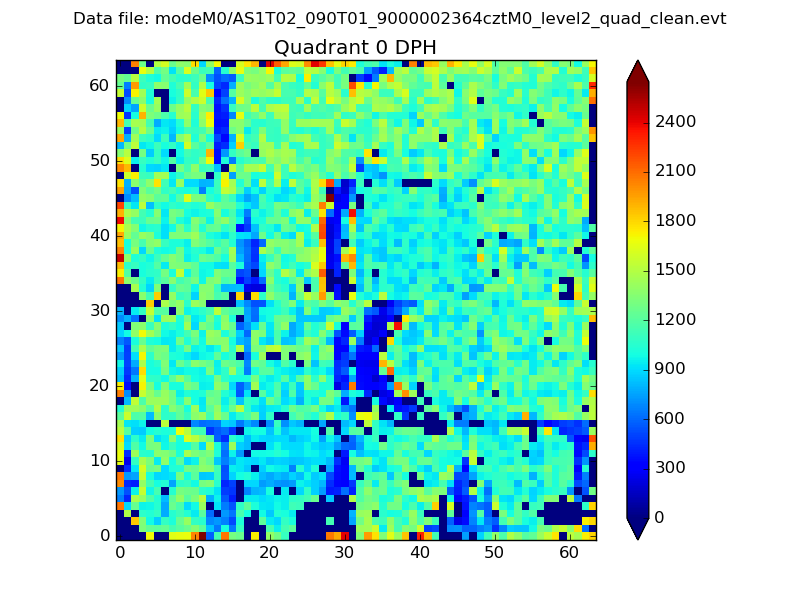 |
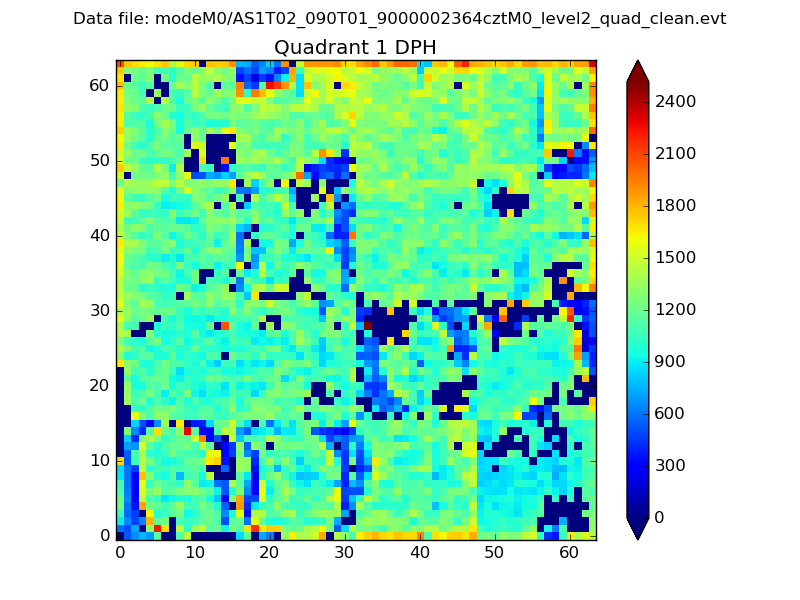 |
Quadrant B |
|---|---|---|---|
| Quadrant D |  |
 |
Quadrant C |
| Plot type | Count rate plots | Images |
|---|---|---|
| Comparison with Poisson distribution Blue bars denote a histogram of data divided into 1 sec bins. Red curve is a Poisson curve with rate = median count rate of data. |
 |
 |
| Quadrant-wise count rates Data is divided into 100 sec bins |
 |
|
| Module-wise count rates for Quadrant A Data is divided into 100 sec bins |
 |
 |
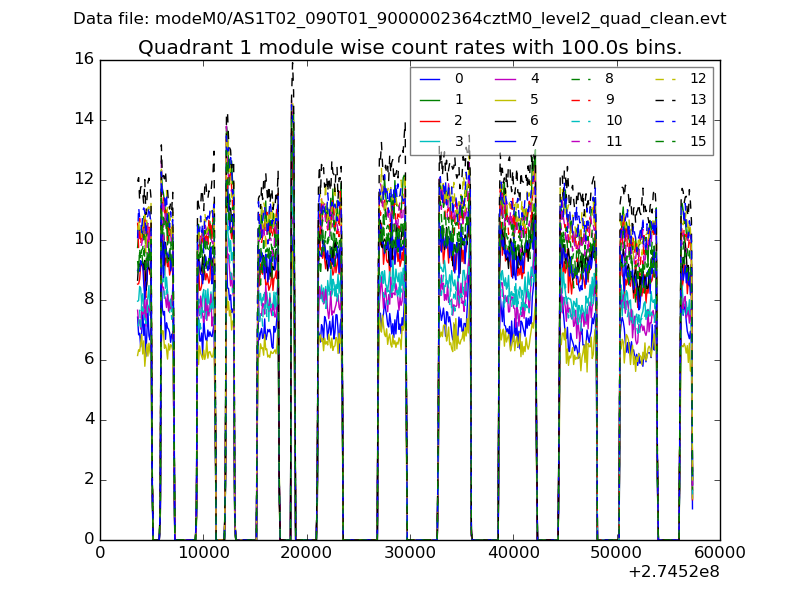
| Module-wise count rates for Quadrant B Data is divided into 100 sec bins |
 |
 |
| Module-wise count rates for Quadrant C Data is divided into 100 sec bins |
 |
 |
| Module-wise count rates for Quadrant D Data is divided into 100 sec bins |
 |
 |
| Parameter | Plot |
|---|---|
| CZT HV Monitor | 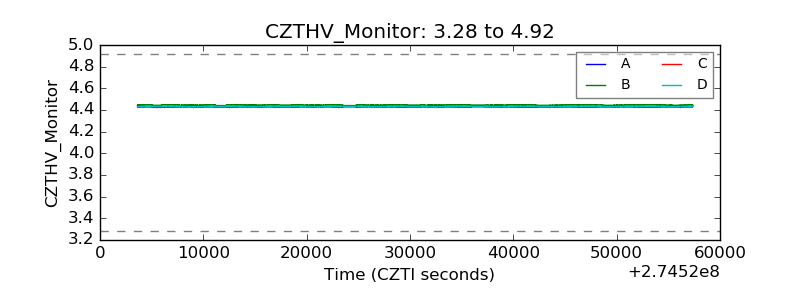 |
| D_VDD |  |
| Temperature 1 |  |
| Veto HV Monitor |  |
| Veto LLD | 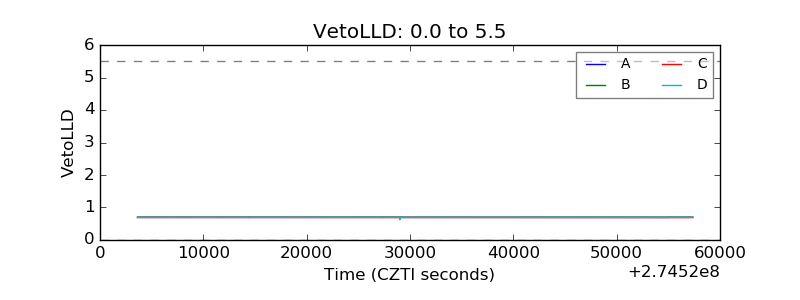 |
| Alpha Counter |  |
| _CPM_Rate | 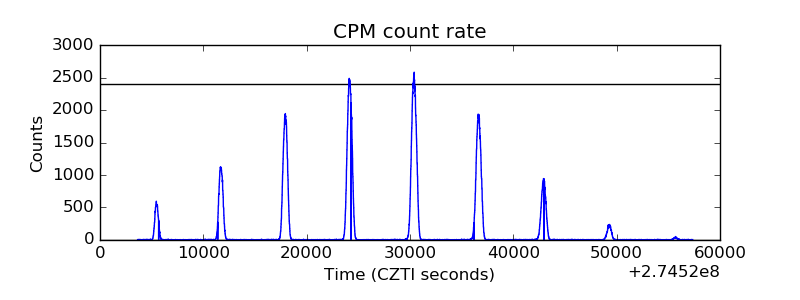 |
| CZT Counter |  |
| +2.5 Volts monitor |  |
| +5 Volts monitor | 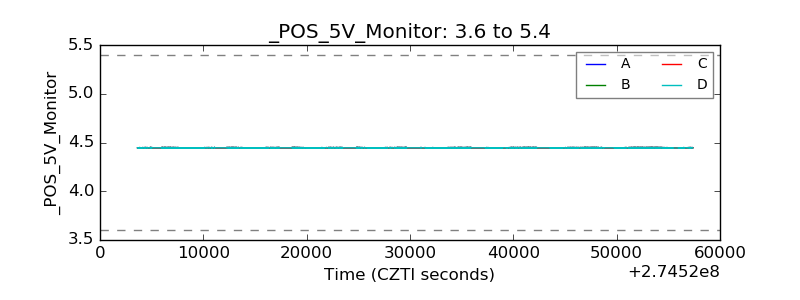 |
| _ROLL_ROT |  |
| _Roll_DEC |  |
| _Roll_RA |  |
| Veto Counter |  |