| Param | Original file | Final file |
|---|---|---|
| Filename | modeM0/AS1G08_046T09_9000002362cztM0_level2_bc.evt | modeM0/AS1G08_046T09_9000002362cztM0_level2_quad_clean.evt |
| Size (bytes) | 1,060,994,880 | 353,698,560 |
| Size | 1011.8 MB | 337.3 MB |
| Events in quadrant A | 8,340,268 | 2,231,633 |
| Events in quadrant B | 5,950,284 | 2,287,904 |
| Events in quadrant C | 5,358,959 | 2,203,083 |
| Events in quadrant D | 10,657,559 | 2,152,465 |
| Mode M9 | |||
|---|---|---|---|
| Quadrant | BADHDUFLAG | Total packets | Discarded packets |
| A | 0 | 22 | 0 |
| B | 0 | 22 | 0 |
| C | 0 | 22 | 0 |
| D | 0 | 22 | 0 |
| Mode SS | |||
|---|---|---|---|
| Quadrant | BADHDUFLAG | Total packets | Discarded packets |
| A | 0 | 544 | 0 |
| B | 0 | 544 | 0 |
| C | 0 | 544 | 0 |
| D | 0 | 544 | 0 |
| Mode M0 | |||
|---|---|---|---|
| Quadrant | BADHDUFLAG | Total packets | Discarded packets |
| A | 0 | 64647 | 0 |
| B | 0 | 57000 | 0 |
| C | 0 | 54954 | 0 |
| D | 0 | 72668 | 0 |
| Quadrant | Total seconds | Saturated seconds | Saturation percentage |
|---|---|---|---|
| A | 26722 | 959 | 3.588803% |
| B | 26722 | 448 | 1.676521% |
| C | 26722 | 424 | 1.586708% |
| D | 26722 | 1287 | 4.816256% |
Noise dominated data is calculated using 1-second bins in cleaned event files. If a bin has >2000 counts, and if more than 50% of those come from <1% of pixels, then it is considered to be noise-dominated and hence unusable.
| Quadrant | # 1 sec bins | Bins with >0 counts | Bins with >2000 counts | High rate bins dominated by noise | Noise dominated (total time) | Noise dominated (detector-on time) | Marked lightcurve |
|---|---|---|---|---|---|---|---|
| A | 28918 | 26719 | 333 | 333 | 1.15% | 1.25% |  |
| B | 28918 | 26721 | 3 | 3 | 0.01% | 0.01% |  |
| C | 28918 | 26719 | 0 | 0 | 0.00% | 0.00% |  |
| D | 28918 | 26720 | 183 | 183 | 0.63% | 0.68% |  |
Top three noisy pixels from each quadrant. If the there are fewer than three noisy pixels in the level2.evt file, extra rows are filled as -1
| Pixel properties | Quadrant properties | ||||||
|---|---|---|---|---|---|---|---|
| Quadrant | DetID | PixID | Counts | Sigma | Mean | Median | Sigma |
| A | 10 | 253 | 2997623 | 10522.28 | 1293 | 1263 | 284.8 |
| A | 13 | 210 | 264007 | 922.67 | 1293 | 1263 | 284.8 |
| A | 15 | 239 | 32170 | 108.53 | 1293 | 1263 | 284.8 |
| B | 7 | 220 | 279102 | 1092.9 | 1316 | 1282 | 254.2 |
| B | 4 | 216 | 102620 | 398.65 | 1316 | 1282 | 254.2 |
| B | 3 | 209 | 73781 | 285.2 | 1316 | 1282 | 254.2 |
| C | 3 | 233 | 431168 | 1442.01 | 1263 | 1256 | 298.1 |
| C | 0 | 207 | 20714 | 65.27 | 1263 | 1256 | 298.1 |
| C | 8 | 128 | 19573 | 61.44 | 1263 | 1256 | 298.1 |
| D | 4 | 239 | 4757640 | 15537.06 | 1287 | 1238 | 306.1 |
| D | 12 | 218 | 229460 | 745.5 | 1287 | 1238 | 306.1 |
| D | 7 | 38 | 198932 | 645.78 | 1287 | 1238 | 306.1 |
Histogram calculated using DETX and DETY for each event in the final _common_clean file
| Quadrant A |  |
 |
Quadrant B |
|---|---|---|---|
| Quadrant D |  |
 |
Quadrant C |
| Plot type | Count rate plots | Images |
|---|---|---|
| Comparison with Poisson distribution Blue bars denote a histogram of data divided into 1 sec bins. Red curve is a Poisson curve with rate = median count rate of data. |
 |
 |
| Quadrant-wise count rates Data is divided into 100 sec bins |
 |
|
| Module-wise count rates for Quadrant A Data is divided into 100 sec bins |
 |
 |
| Module-wise count rates for Quadrant B Data is divided into 100 sec bins |
 |
 |
| Module-wise count rates for Quadrant C Data is divided into 100 sec bins |
 |
 |
| Module-wise count rates for Quadrant D Data is divided into 100 sec bins |
 |
 |
| Parameter | Plot |
|---|---|
| CZT HV Monitor |  |
| D_VDD |  |
| Temperature 1 |  |
| Veto HV Monitor | 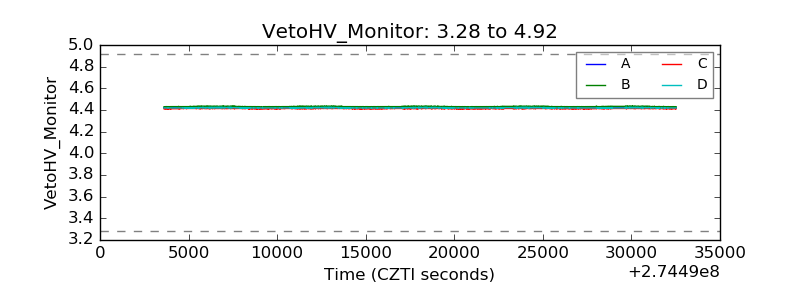 |
| Veto LLD |  |
| Alpha Counter |  |
| _CPM_Rate | 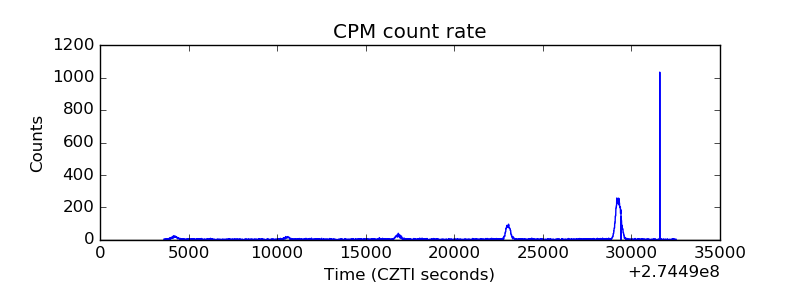 |
| CZT Counter | 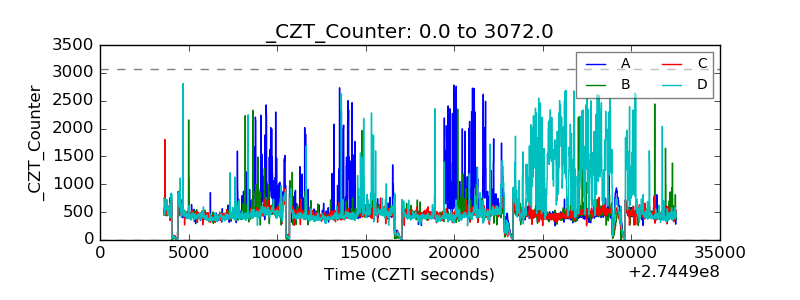 |
| +2.5 Volts monitor |  |
| +5 Volts monitor |  |
| _ROLL_ROT | 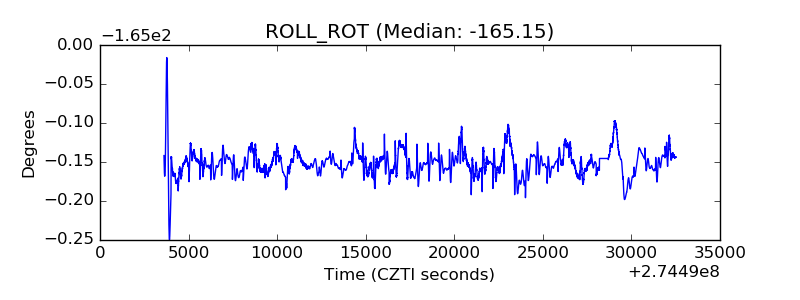 |
| _Roll_DEC |  |
| _Roll_RA |  |
| Veto Counter |  |