| Param | Original file | Final file |
|---|---|---|
| Filename | modeM0/AS1C03_015T03_9000002366cztM0_level2_bc.evt | modeM0/AS1C03_015T03_9000002366cztM0_level2_quad_clean.evt |
| Size (bytes) | 440,881,920 | 267,696,000 |
| Size | 420.5 MB | 255.3 MB |
| Events in quadrant A | 2,978,727 | 1,778,952 |
| Events in quadrant B | 3,311,289 | 1,820,398 |
| Events in quadrant C | 2,877,417 | 1,761,813 |
| Events in quadrant D | 3,177,534 | 1,735,475 |
| Mode M0 | |||
|---|---|---|---|
| Quadrant | BADHDUFLAG | Total packets | Discarded packets |
| A | 0 | 30312 | 0 |
| B | 0 | 31714 | 0 |
| C | 0 | 30148 | 0 |
| D | 0 | 30790 | 0 |
| Mode M9 | |||
|---|---|---|---|
| Quadrant | BADHDUFLAG | Total packets | Discarded packets |
| A | 0 | 5 | 0 |
| B | 0 | 5 | 0 |
| C | 0 | 5 | 0 |
| D | 0 | 5 | 0 |
| Mode SS | |||
|---|---|---|---|
| Quadrant | BADHDUFLAG | Total packets | Discarded packets |
| A | 0 | 300 | 0 |
| B | 0 | 300 | 0 |
| C | 0 | 300 | 0 |
| D | 0 | 300 | 0 |
| Quadrant | Total seconds | Saturated seconds | Saturation percentage |
|---|---|---|---|
| A | 14664 | 47 | 0.320513% |
| B | 14664 | 198 | 1.350245% |
| C | 14664 | 105 | 0.716039% |
| D | 14664 | 52 | 0.354610% |
Noise dominated data is calculated using 1-second bins in cleaned event files. If a bin has >2000 counts, and if more than 50% of those come from <1% of pixels, then it is considered to be noise-dominated and hence unusable.
| Quadrant | # 1 sec bins | Bins with >0 counts | Bins with >2000 counts | High rate bins dominated by noise | Noise dominated (total time) | Noise dominated (detector-on time) | Marked lightcurve |
|---|---|---|---|---|---|---|---|
| A | 15236 | 14665 | 2 | 2 | 0.01% | 0.01% |  |
| B | 15236 | 14666 | 26 | 26 | 0.17% | 0.18% |  |
| C | 15236 | 14665 | 0 | 0 | 0.00% | 0.00% | 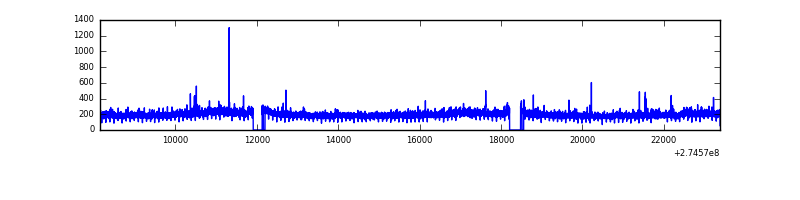 |
| D | 15236 | 14665 | 4 | 4 | 0.03% | 0.03% |  |
Top three noisy pixels from each quadrant. If the there are fewer than three noisy pixels in the level2.evt file, extra rows are filled as -1
| Pixel properties | Quadrant properties | ||||||
|---|---|---|---|---|---|---|---|
| Quadrant | DetID | PixID | Counts | Sigma | Mean | Median | Sigma |
| A | 15 | 157 | 72298 | 448.58 | 718 | 702 | 159.6 |
| A | 14 | 239 | 30697 | 187.93 | 718 | 702 | 159.6 |
| A | 15 | 239 | 27666 | 168.94 | 718 | 702 | 159.6 |
| B | 0 | 245 | 191878 | 1330.61 | 727 | 708 | 143.7 |
| B | 7 | 220 | 109378 | 756.38 | 727 | 708 | 143.7 |
| B | 4 | 173 | 43044 | 294.67 | 727 | 708 | 143.7 |
| C | 3 | 233 | 129154 | 769.66 | 701 | 695 | 166.9 |
| C | 8 | 128 | 20210 | 116.92 | 701 | 695 | 166.9 |
| C | 0 | 207 | 10788 | 60.47 | 701 | 695 | 166.9 |
| D | 2 | 152 | 184799 | 1095.9 | 716 | 690 | 168.0 |
| D | 10 | 70 | 115283 | 682.11 | 716 | 690 | 168.0 |
| D | 2 | 16 | 62607 | 368.56 | 716 | 690 | 168.0 |
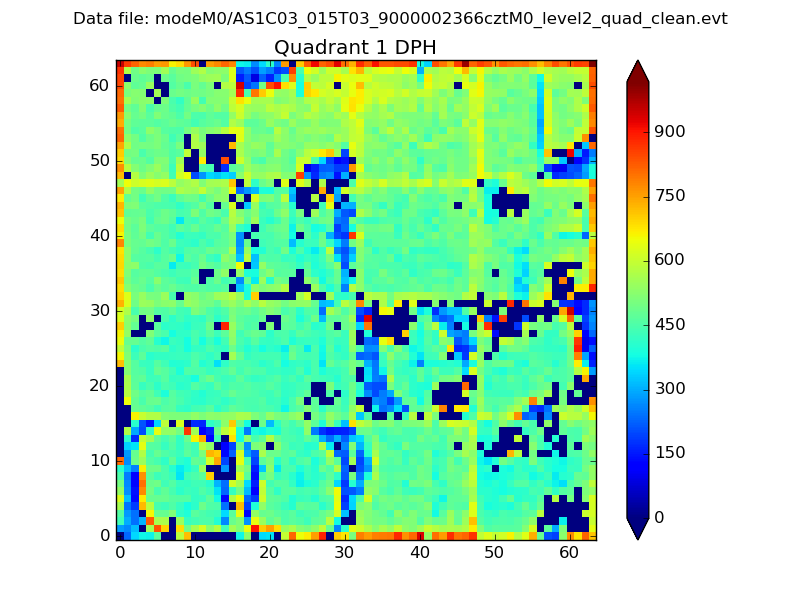
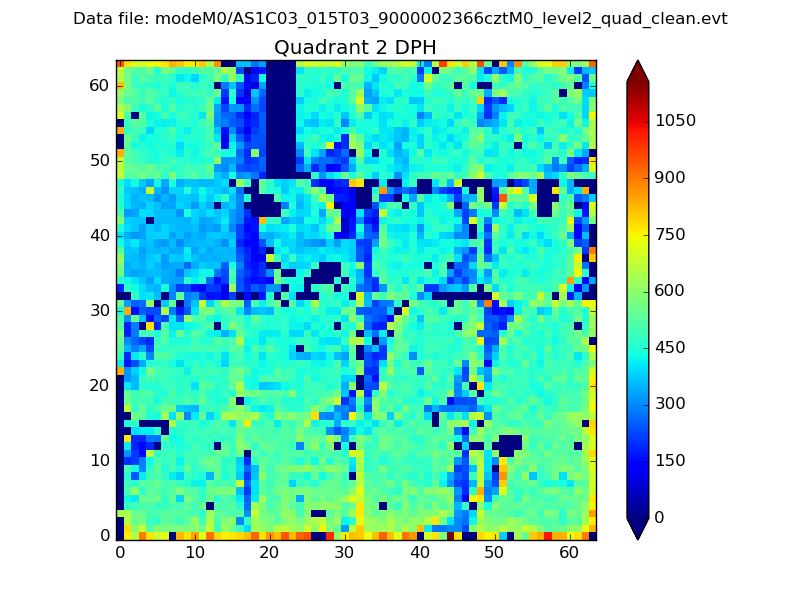
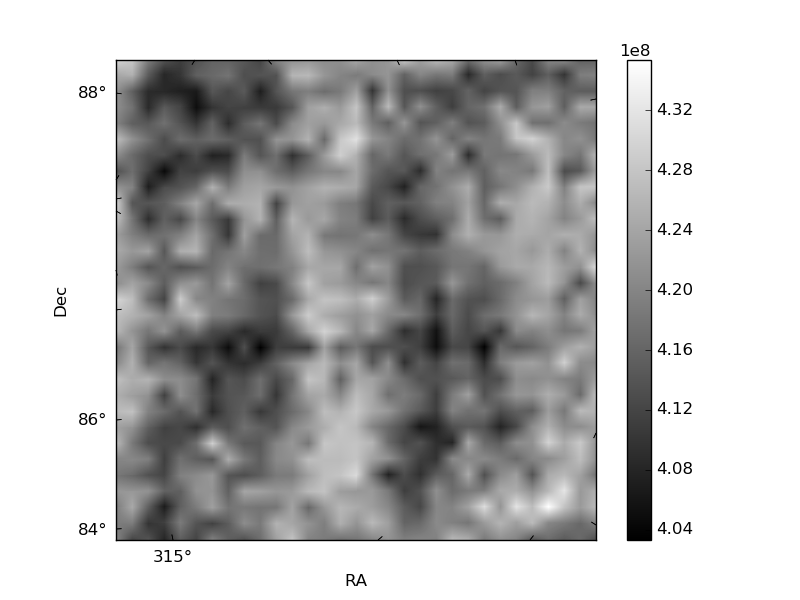
Histogram calculated using DETX and DETY for each event in the final _common_clean file
| Quadrant A |  |
 |
Quadrant B |
|---|---|---|---|
| Quadrant D |  |
 |
Quadrant C |
| Plot type | Count rate plots | Images |
|---|---|---|
| Comparison with Poisson distribution Blue bars denote a histogram of data divided into 1 sec bins. Red curve is a Poisson curve with rate = median count rate of data. |
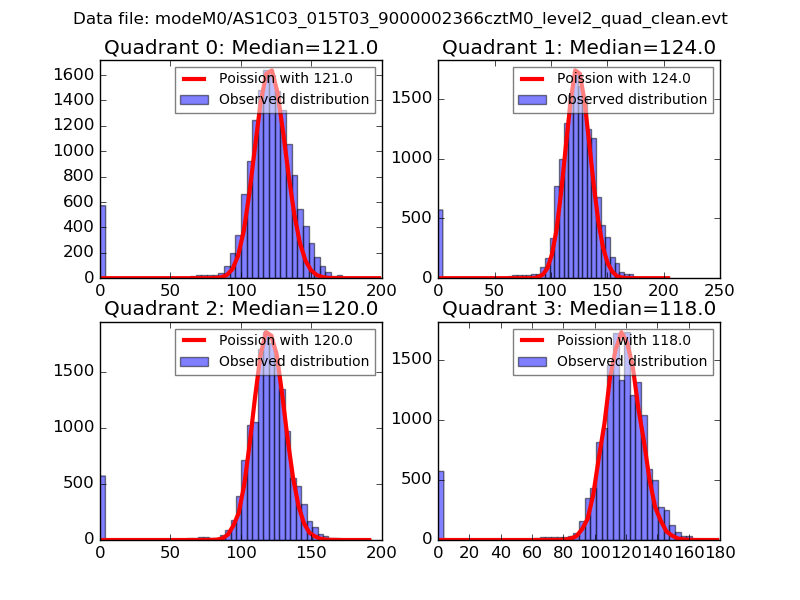 |
 |
| Quadrant-wise count rates Data is divided into 100 sec bins |
 |
|
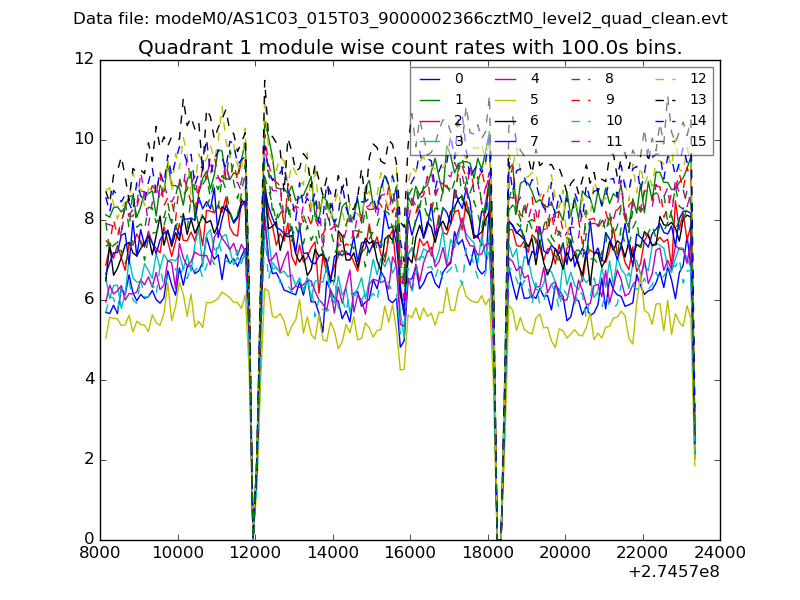
| Module-wise count rates for Quadrant A Data is divided into 100 sec bins |
 |
 |
| Module-wise count rates for Quadrant B Data is divided into 100 sec bins |
 |
 |
| Module-wise count rates for Quadrant C Data is divided into 100 sec bins |
 |
 |
| Module-wise count rates for Quadrant D Data is divided into 100 sec bins |
 |
 |
| Parameter | Plot |
|---|---|
| CZT HV Monitor | 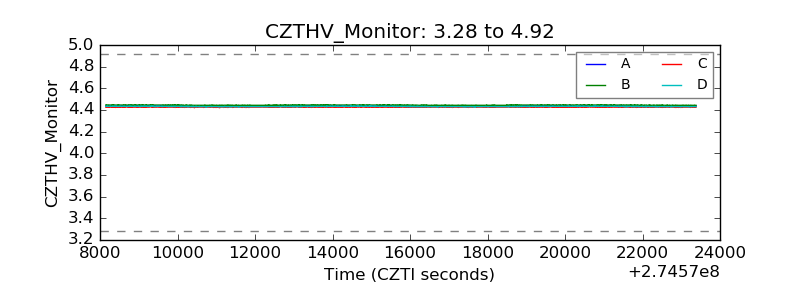 |
| D_VDD |  |
| Temperature 1 |  |
| Veto HV Monitor | 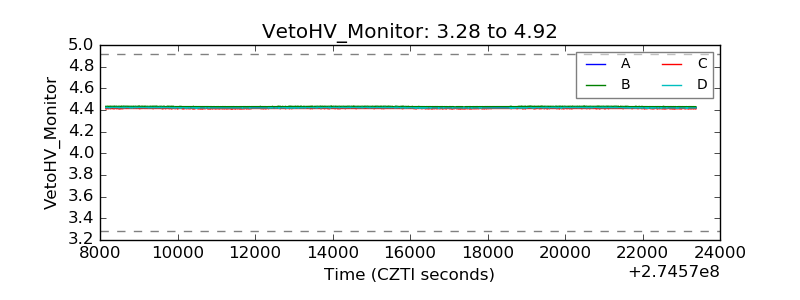 |
| Veto LLD |  |
| Alpha Counter |  |
| _CPM_Rate |  |
| CZT Counter |  |
| +2.5 Volts monitor |  |
| +5 Volts monitor |  |
| _ROLL_ROT | 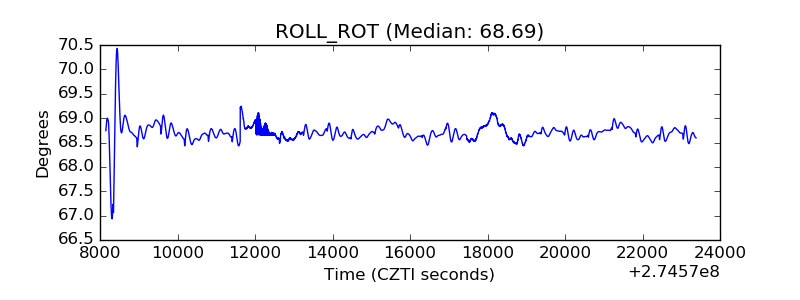 |
| _Roll_DEC |  |
| _Roll_RA | 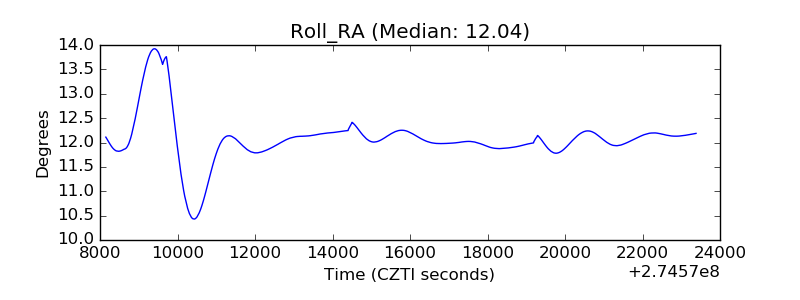 |
| Veto Counter |  |