| Param | Original file | Final file |
|---|---|---|
| Filename | modeM0/AS1T02_090T01_9000002360cztM0_level2_bc.evt | modeM0/AS1T02_090T01_9000002360cztM0_level2_quad_clean.evt |
| Size (bytes) | 1,020,911,040 | 404,328,960 |
| Size | 973.6 MB | 385.6 MB |
| Events in quadrant A | 6,461,790 | 2,650,025 |
| Events in quadrant B | 8,492,733 | 2,649,320 |
| Events in quadrant C | 7,139,651 | 2,578,024 |
| Events in quadrant D | 7,000,832 | 2,534,439 |
| Mode M9 | |||
|---|---|---|---|
| Quadrant | BADHDUFLAG | Total packets | Discarded packets |
| A | 0 | 70 | 0 |
| B | 0 | 70 | 0 |
| C | 0 | 70 | 0 |
| D | 0 | 70 | 0 |
| Mode M0 | |||
|---|---|---|---|
| Quadrant | BADHDUFLAG | Total packets | Discarded packets |
| A | 0 | 57983 | 0 |
| B | 0 | 67170 | 0 |
| C | 0 | 61484 | 0 |
| D | 0 | 60014 | 0 |
| Mode SS | |||
|---|---|---|---|
| Quadrant | BADHDUFLAG | Total packets | Discarded packets |
| A | 0 | 544 | 0 |
| B | 0 | 544 | 0 |
| C | 0 | 544 | 0 |
| D | 0 | 544 | 0 |
| Quadrant | Total seconds | Saturated seconds | Saturation percentage |
|---|---|---|---|
| A | 26691 | 343 | 1.285077% |
| B | 26691 | 1012 | 3.791540% |
| C | 26691 | 664 | 2.487730% |
| D | 26691 | 382 | 1.431194% |
Noise dominated data is calculated using 1-second bins in cleaned event files. If a bin has >2000 counts, and if more than 50% of those come from <1% of pixels, then it is considered to be noise-dominated and hence unusable.
| Quadrant | # 1 sec bins | Bins with >0 counts | Bins with >2000 counts | High rate bins dominated by noise | Noise dominated (total time) | Noise dominated (detector-on time) | Marked lightcurve |
|---|---|---|---|---|---|---|---|
| A | 32556 | 26688 | 1 | 1 | 0.00% | 0.00% |  |
| B | 32556 | 26686 | 42 | 42 | 0.13% | 0.16% | 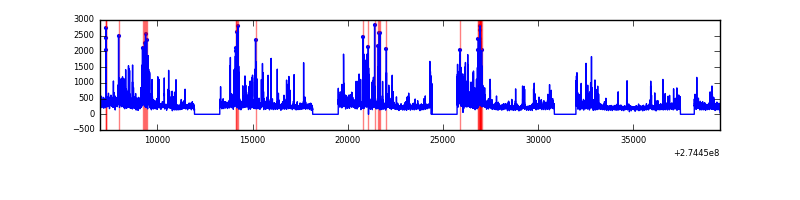 |
| C | 32556 | 26688 | 38 | 38 | 0.12% | 0.14% | 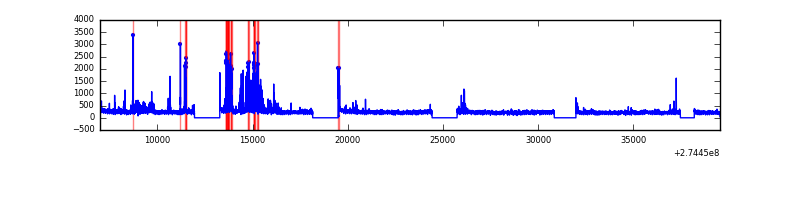 |
| D | 32556 | 26688 | 4 | 4 | 0.01% | 0.01% |  |
Top three noisy pixels from each quadrant. If the there are fewer than three noisy pixels in the level2.evt file, extra rows are filled as -1
| Pixel properties | Quadrant properties | ||||||
|---|---|---|---|---|---|---|---|
| Quadrant | DetID | PixID | Counts | Sigma | Mean | Median | Sigma |
| A | 15 | 239 | 114269 | 316.67 | 1616 | 1586 | 355.8 |
| A | 9 | 143 | 55272 | 150.87 | 1616 | 1586 | 355.8 |
| A | 13 | 210 | 36508 | 98.14 | 1616 | 1586 | 355.8 |
| B | 10 | 245 | 731977 | 2399.54 | 1615 | 1589 | 304.4 |
| B | 7 | 220 | 609345 | 1996.66 | 1615 | 1589 | 304.4 |
| B | 4 | 173 | 144161 | 468.39 | 1615 | 1589 | 304.4 |
| C | 9 | 236 | 639161 | 1742.55 | 1566 | 1575 | 365.9 |
| C | 0 | 207 | 230689 | 626.18 | 1566 | 1575 | 365.9 |
| C | 3 | 233 | 216637 | 587.77 | 1566 | 1575 | 365.9 |
| D | 2 | 152 | 256699 | 690.45 | 1600 | 1552 | 369.5 |
| D | 12 | 218 | 186928 | 501.65 | 1600 | 1552 | 369.5 |
| D | 9 | 85 | 129742 | 346.9 | 1600 | 1552 | 369.5 |
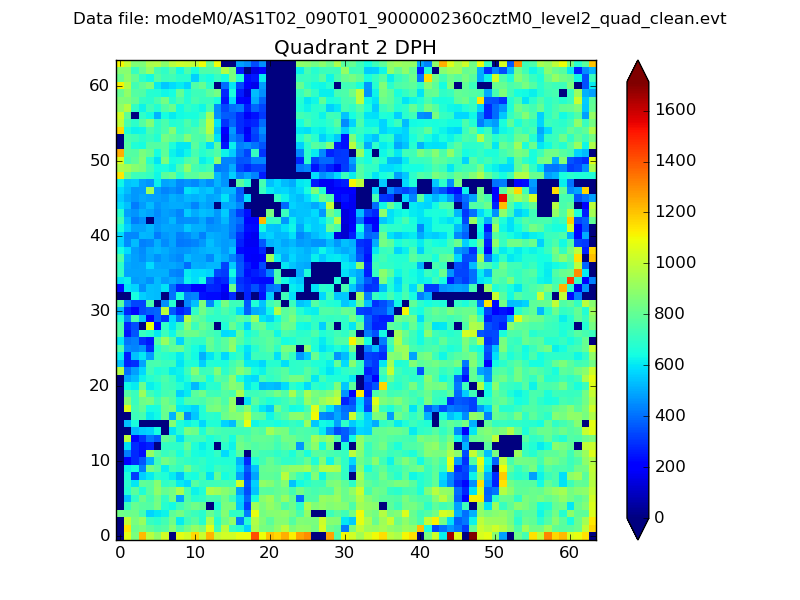
Histogram calculated using DETX and DETY for each event in the final _common_clean file
| Quadrant A | 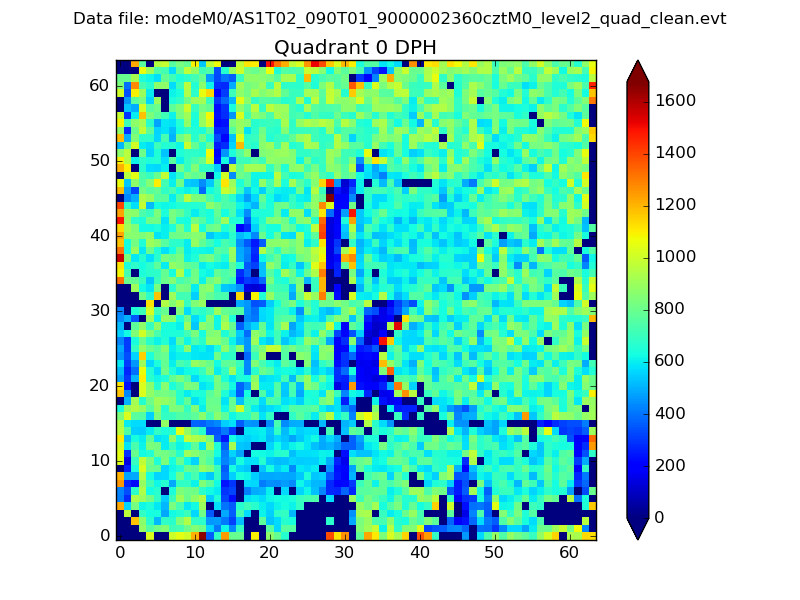 |
 |
Quadrant B |
|---|---|---|---|
| Quadrant D | 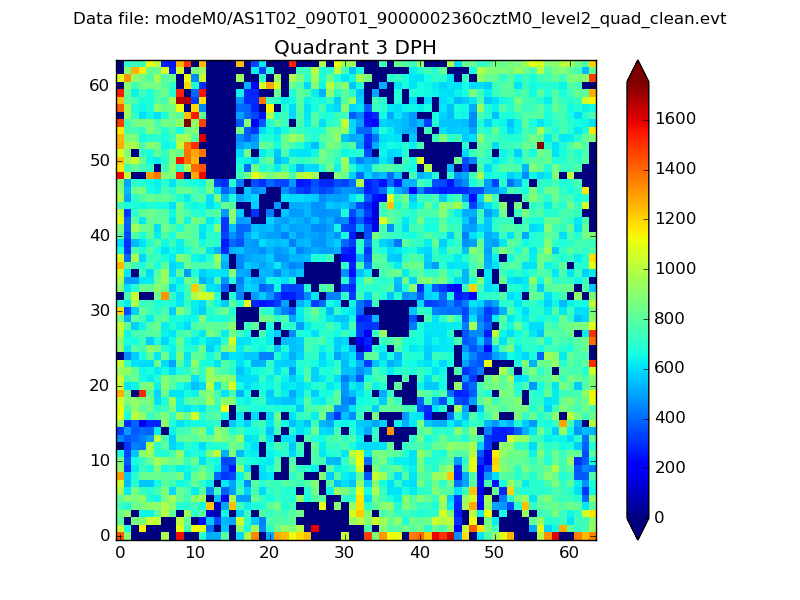 |
 |
Quadrant C |
| Plot type | Count rate plots | Images |
|---|---|---|
| Comparison with Poisson distribution Blue bars denote a histogram of data divided into 1 sec bins. Red curve is a Poisson curve with rate = median count rate of data. |
 |
 |
| Quadrant-wise count rates Data is divided into 100 sec bins |
 |
|
| Module-wise count rates for Quadrant A Data is divided into 100 sec bins |
 |
 |
| Module-wise count rates for Quadrant B Data is divided into 100 sec bins |
 |
 |
| Module-wise count rates for Quadrant C Data is divided into 100 sec bins |
 |
 |
| Module-wise count rates for Quadrant D Data is divided into 100 sec bins |
 |
 |
| Parameter | Plot |
|---|---|
| CZT HV Monitor |  |
| D_VDD |  |
| Temperature 1 |  |
| Veto HV Monitor | 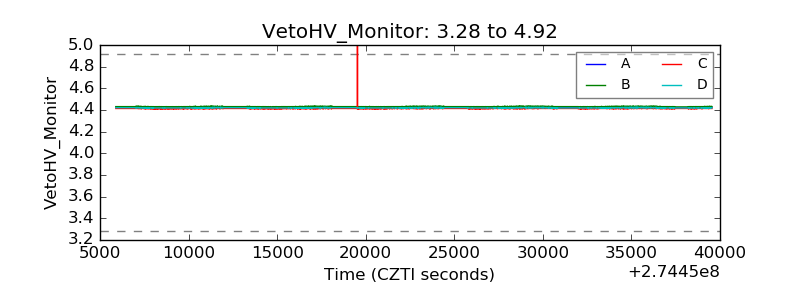 |
| Veto LLD |  |
| Alpha Counter |  |
| _CPM_Rate |  |
| CZT Counter |  |
| +2.5 Volts monitor | 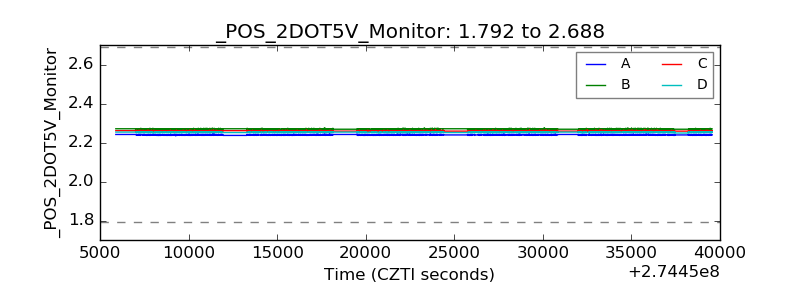 |
| +5 Volts monitor |  |
| _ROLL_ROT | 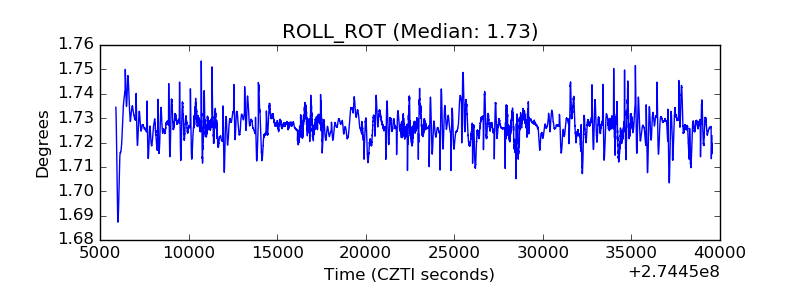 |
| _Roll_DEC | 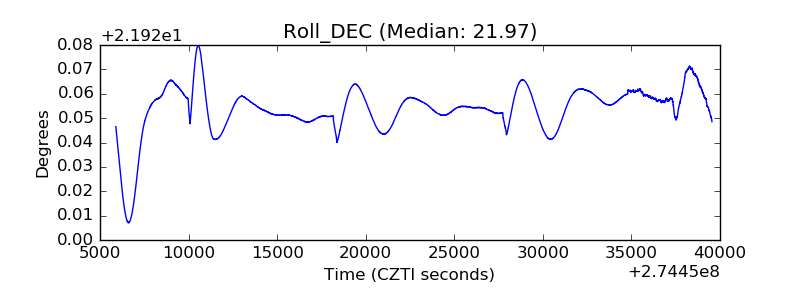 |
| _Roll_RA | 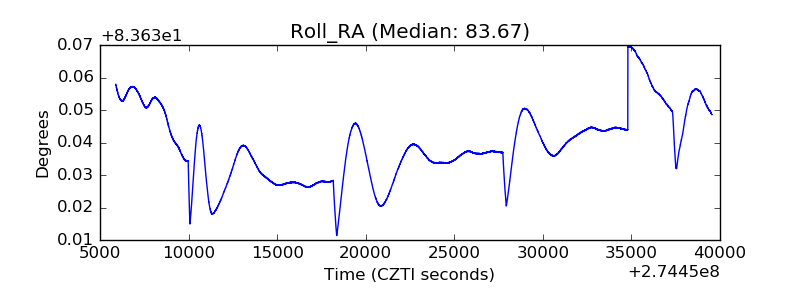 |
| Veto Counter |  |