| Param | Original file | Final file |
|---|---|---|
| Filename | modeM0/AS1G08_046T09_9000002358cztM0_level2_bc.evt | modeM0/AS1G08_046T09_9000002358cztM0_level2_quad_clean.evt |
| Size (bytes) | 1,108,638,720 | 504,780,480 |
| Size | 1.0 GB | 481.4 MB |
| Events in quadrant A | 7,821,012 | 3,269,741 |
| Events in quadrant B | 8,585,012 | 3,282,729 |
| Events in quadrant C | 6,928,464 | 3,142,922 |
| Events in quadrant D | 7,794,277 | 3,135,597 |
| Mode SS | |||
|---|---|---|---|
| Quadrant | BADHDUFLAG | Total packets | Discarded packets |
| A | 0 | 726 | 0 |
| B | 0 | 726 | 0 |
| C | 0 | 726 | 0 |
| D | 0 | 726 | 0 |
| Mode M0 | |||
|---|---|---|---|
| Quadrant | BADHDUFLAG | Total packets | Discarded packets |
| A | 0 | 76404 | 0 |
| B | 0 | 78105 | 0 |
| C | 0 | 73256 | 0 |
| D | 0 | 75380 | 0 |
| Mode M9 | |||
|---|---|---|---|
| Quadrant | BADHDUFLAG | Total packets | Discarded packets |
| A | 0 | 43 | 0 |
| B | 0 | 43 | 0 |
| C | 0 | 43 | 0 |
| D | 0 | 43 | 0 |
| Quadrant | Total seconds | Saturated seconds | Saturation percentage |
|---|---|---|---|
| A | 35806 | 757 | 2.114171% |
| B | 35806 | 591 | 1.650561% |
| C | 35806 | 455 | 1.270737% |
| D | 35806 | 426 | 1.189745% |
Noise dominated data is calculated using 1-second bins in cleaned event files. If a bin has >2000 counts, and if more than 50% of those come from <1% of pixels, then it is considered to be noise-dominated and hence unusable.
| Quadrant | # 1 sec bins | Bins with >0 counts | Bins with >2000 counts | High rate bins dominated by noise | Noise dominated (total time) | Noise dominated (detector-on time) | Marked lightcurve |
|---|---|---|---|---|---|---|---|
| A | 39982 | 35801 | 36 | 36 | 0.09% | 0.10% |  |
| B | 39982 | 35801 | 6 | 6 | 0.02% | 0.02% | 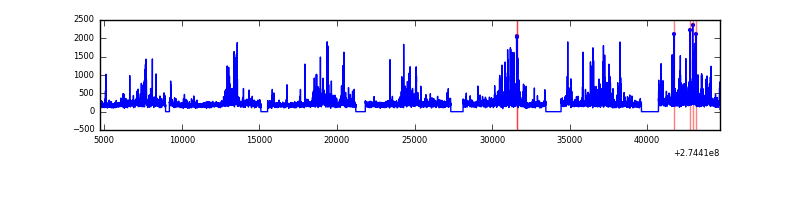 |
| C | 39982 | 35802 | 5 | 5 | 0.01% | 0.01% |  |
| D | 39982 | 35802 | 10 | 10 | 0.03% | 0.03% |  |
Top three noisy pixels from each quadrant. If the there are fewer than three noisy pixels in the level2.evt file, extra rows are filled as -1
| Pixel properties | Quadrant properties | ||||||
|---|---|---|---|---|---|---|---|
| Quadrant | DetID | PixID | Counts | Sigma | Mean | Median | Sigma |
| A | 15 | 239 | 697840 | 1788.78 | 1771 | 1734 | 389.2 |
| A | 15 | 157 | 134774 | 341.87 | 1771 | 1734 | 389.2 |
| A | 13 | 210 | 109774 | 277.63 | 1771 | 1734 | 389.2 |
| B | 7 | 220 | 403010 | 1197.44 | 1780 | 1738 | 335.1 |
| B | 10 | 245 | 205362 | 607.64 | 1780 | 1738 | 335.1 |
| B | 5 | 65 | 150775 | 444.74 | 1780 | 1738 | 335.1 |
| C | 3 | 233 | 260631 | 647.07 | 1703 | 1690 | 400.2 |
| C | 0 | 207 | 58409 | 141.74 | 1703 | 1690 | 400.2 |
| C | 9 | 236 | 17472 | 39.44 | 1703 | 1690 | 400.2 |
| D | 10 | 70 | 235780 | 571.4 | 1757 | 1695 | 409.7 |
| D | 2 | 152 | 218289 | 528.71 | 1757 | 1695 | 409.7 |
| D | 2 | 234 | 162168 | 391.72 | 1757 | 1695 | 409.7 |
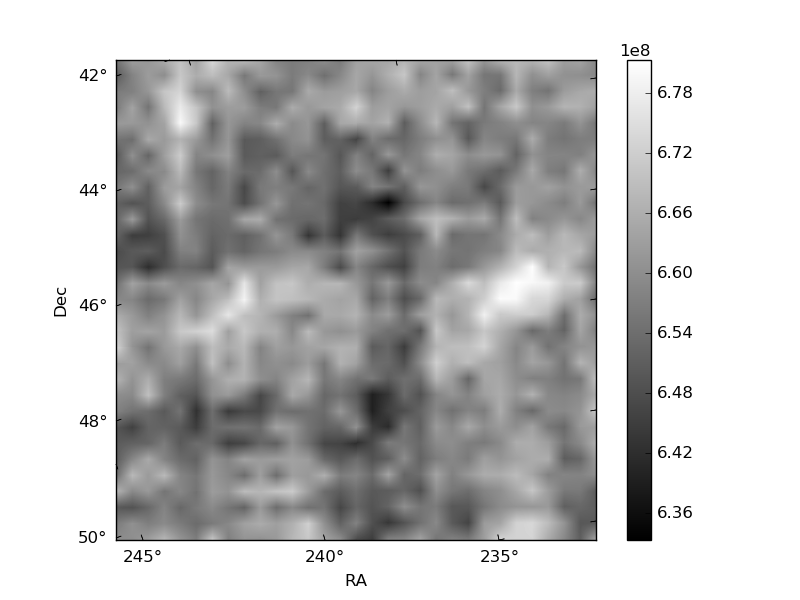
Histogram calculated using DETX and DETY for each event in the final _common_clean file
| Quadrant A |  |
 |
Quadrant B |
|---|---|---|---|
| Quadrant D |  |
 |
Quadrant C |
| Plot type | Count rate plots | Images |
|---|---|---|
| Comparison with Poisson distribution Blue bars denote a histogram of data divided into 1 sec bins. Red curve is a Poisson curve with rate = median count rate of data. |
 |
 |
| Quadrant-wise count rates Data is divided into 100 sec bins |
 |
|
| Module-wise count rates for Quadrant A Data is divided into 100 sec bins |
 |
 |
| Module-wise count rates for Quadrant B Data is divided into 100 sec bins |
 |
 |
| Module-wise count rates for Quadrant C Data is divided into 100 sec bins |
 |
 |
| Module-wise count rates for Quadrant D Data is divided into 100 sec bins |
 |
 |
| Parameter | Plot |
|---|---|
| CZT HV Monitor |  |
| D_VDD |  |
| Temperature 1 |  |
| Veto HV Monitor |  |
| Veto LLD |  |
| Alpha Counter |  |
| _CPM_Rate |  |
| CZT Counter |  |
| +2.5 Volts monitor |  |
| +5 Volts monitor |  |
| _ROLL_ROT |  |
| _Roll_DEC |  |
| _Roll_RA |  |
| Veto Counter |  |