| Param | Original file | Final file |
|---|---|---|
| Filename | modeM0/AS1T02_104T01_9000002356cztM0_level2_bc.evt | modeM0/AS1T02_104T01_9000002356cztM0_level2_quad_clean.evt |
| Size (bytes) | 774,308,160 | 334,831,680 |
| Size | 738.4 MB | 319.3 MB |
| Events in quadrant A | 5,305,567 | 2,117,893 |
| Events in quadrant B | 5,501,757 | 2,171,196 |
| Events in quadrant C | 5,186,524 | 2,098,366 |
| Events in quadrant D | 5,752,873 | 2,042,100 |
| Mode M9 | |||
|---|---|---|---|
| Quadrant | BADHDUFLAG | Total packets | Discarded packets |
| A | 0 | 42 | 0 |
| B | 0 | 42 | 0 |
| C | 0 | 42 | 0 |
| D | 0 | 42 | 0 |
| Mode M0 | |||
|---|---|---|---|
| Quadrant | BADHDUFLAG | Total packets | Discarded packets |
| A | 0 | 52594 | 0 |
| B | 0 | 53242 | 0 |
| C | 0 | 52578 | 0 |
| D | 0 | 54838 | 0 |
| Mode SS | |||
|---|---|---|---|
| Quadrant | BADHDUFLAG | Total packets | Discarded packets |
| A | 0 | 508 | 0 |
| B | 0 | 508 | 0 |
| C | 0 | 508 | 0 |
| D | 0 | 508 | 0 |
| Quadrant | Total seconds | Saturated seconds | Saturation percentage |
|---|---|---|---|
| A | 24888 | 275 | 1.104950% |
| B | 24888 | 335 | 1.346030% |
| C | 24888 | 414 | 1.663452% |
| D | 24888 | 423 | 1.699614% |
Noise dominated data is calculated using 1-second bins in cleaned event files. If a bin has >2000 counts, and if more than 50% of those come from <1% of pixels, then it is considered to be noise-dominated and hence unusable.
| Quadrant | # 1 sec bins | Bins with >0 counts | Bins with >2000 counts | High rate bins dominated by noise | Noise dominated (total time) | Noise dominated (detector-on time) | Marked lightcurve |
|---|---|---|---|---|---|---|---|
| A | 29024 | 24889 | 50 | 50 | 0.17% | 0.20% |  |
| B | 29024 | 24888 | 2 | 2 | 0.01% | 0.01% | 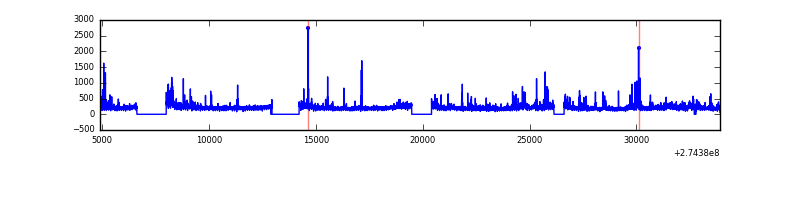 |
| C | 29024 | 24890 | 4 | 4 | 0.01% | 0.02% |  |
| D | 29024 | 24891 | 7 | 7 | 0.02% | 0.03% |  |
Top three noisy pixels from each quadrant. If the there are fewer than three noisy pixels in the level2.evt file, extra rows are filled as -1
| Pixel properties | Quadrant properties | ||||||
|---|---|---|---|---|---|---|---|
| Quadrant | DetID | PixID | Counts | Sigma | Mean | Median | Sigma |
| A | 15 | 239 | 393054 | 1417.27 | 1272 | 1248 | 276.5 |
| A | 12 | 96 | 18281 | 61.61 | 1272 | 1248 | 276.5 |
| A | 9 | 143 | 14115 | 46.54 | 1272 | 1248 | 276.5 |
| B | 15 | 222 | 145144 | 582.54 | 1299 | 1266 | 247.0 |
| B | 4 | 173 | 83254 | 331.96 | 1299 | 1266 | 247.0 |
| B | 10 | 245 | 76023 | 302.68 | 1299 | 1266 | 247.0 |
| C | 9 | 236 | 190722 | 647.83 | 1245 | 1235 | 292.5 |
| C | 0 | 207 | 60136 | 201.38 | 1245 | 1235 | 292.5 |
| C | 3 | 233 | 56083 | 187.52 | 1245 | 1235 | 292.5 |
| D | 10 | 70 | 427801 | 1458.49 | 1260 | 1217 | 292.5 |
| D | 12 | 110 | 267777 | 911.37 | 1260 | 1217 | 292.5 |
| D | 2 | 234 | 106040 | 358.39 | 1260 | 1217 | 292.5 |
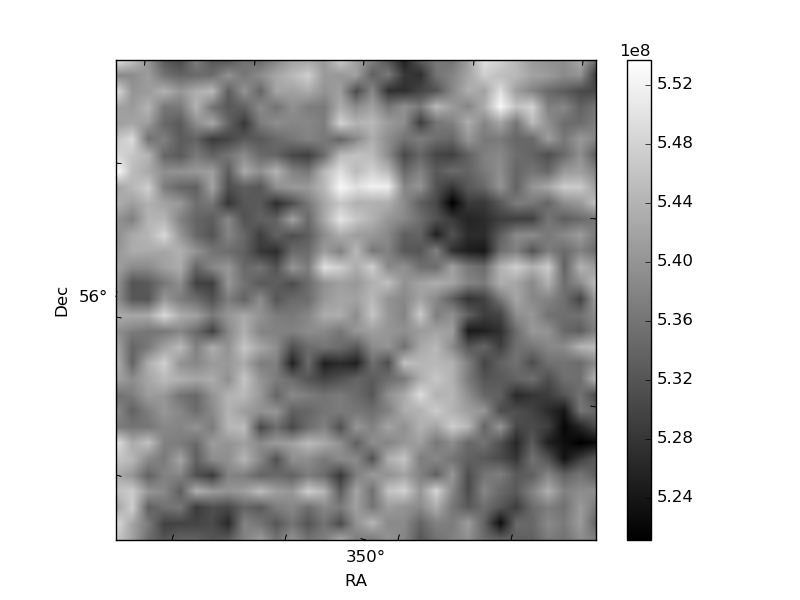
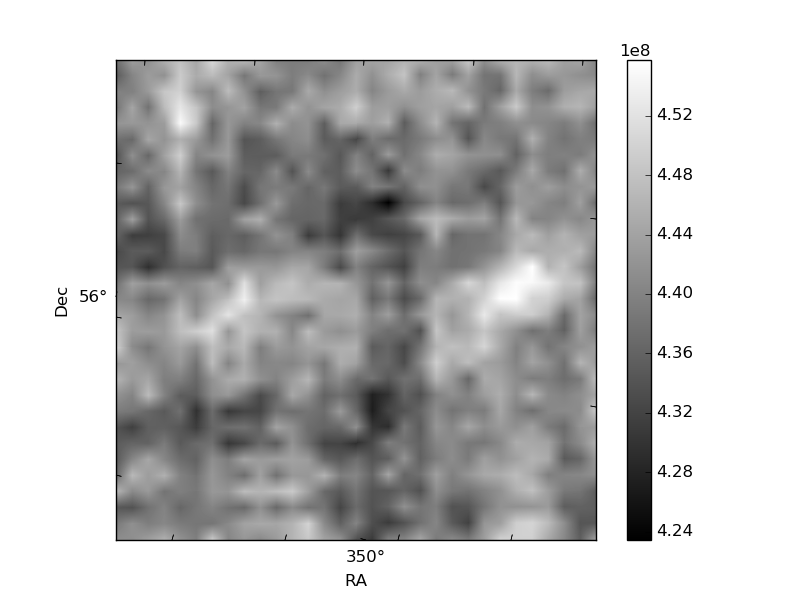
Histogram calculated using DETX and DETY for each event in the final _common_clean file
| Quadrant A |  |
 |
Quadrant B |
|---|---|---|---|
| Quadrant D |  |
 |
Quadrant C |
| Plot type | Count rate plots | Images |
|---|---|---|
| Comparison with Poisson distribution Blue bars denote a histogram of data divided into 1 sec bins. Red curve is a Poisson curve with rate = median count rate of data. |
 |
 |
| Quadrant-wise count rates Data is divided into 100 sec bins |
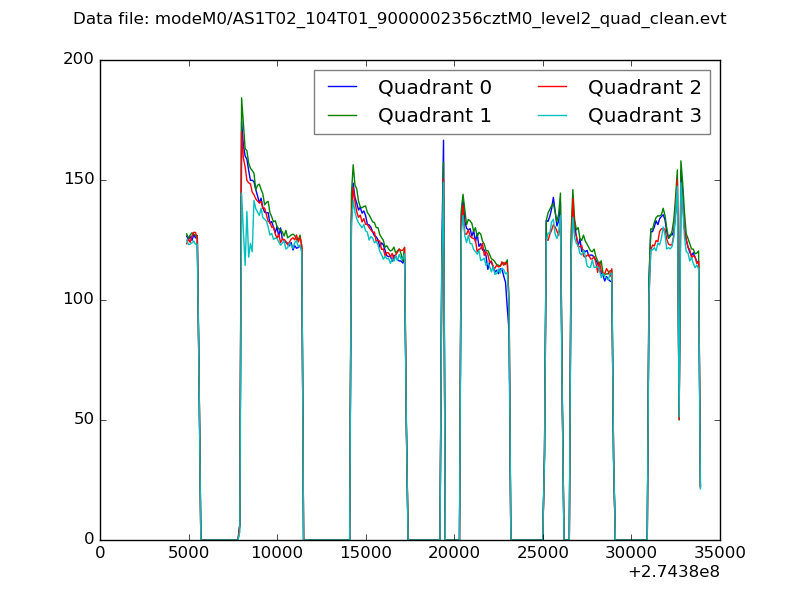 |
|
| Module-wise count rates for Quadrant A Data is divided into 100 sec bins |
 |
 |
| Module-wise count rates for Quadrant B Data is divided into 100 sec bins |
 |
 |
| Module-wise count rates for Quadrant C Data is divided into 100 sec bins |
 |
 |
| Module-wise count rates for Quadrant D Data is divided into 100 sec bins |
 |
 |
| Parameter | Plot |
|---|---|
| CZT HV Monitor |  |
| D_VDD | 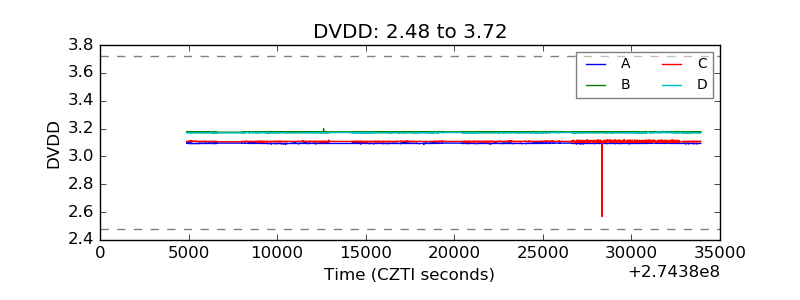 |
| Temperature 1 |  |
| Veto HV Monitor |  |
| Veto LLD |  |
| Alpha Counter |  |
| _CPM_Rate |  |
| CZT Counter |  |
| +2.5 Volts monitor |  |
| +5 Volts monitor |  |
| _ROLL_ROT |  |
| _Roll_DEC |  |
| _Roll_RA |  |
| Veto Counter |  |