| Param | Original file | Final file |
|---|---|---|
| Filename | modeM0/AS1T02_087T01_9000002352cztM0_level2_bc.evt | modeM0/AS1T02_087T01_9000002352cztM0_level2_quad_clean.evt |
| Size (bytes) | 3,045,064,320 | 1,228,296,960 |
| Size | 2.8 GB | 1.1 GB |
| Events in quadrant A | 20,292,999 | 7,849,559 |
| Events in quadrant B | 24,667,697 | 7,868,624 |
| Events in quadrant C | 19,671,974 | 7,542,295 |
| Events in quadrant D | 21,101,105 | 7,423,569 |
| Mode M9 | |||
|---|---|---|---|
| Quadrant | BADHDUFLAG | Total packets | Discarded packets |
| A | 0 | 144 | 0 |
| B | 0 | 144 | 0 |
| C | 0 | 144 | 0 |
| D | 0 | 144 | 0 |
| Mode SS | |||
|---|---|---|---|
| Quadrant | BADHDUFLAG | Total packets | Discarded packets |
| A | 0 | 1936 | 0 |
| B | 0 | 1936 | 0 |
| C | 0 | 1936 | 0 |
| D | 0 | 1936 | 0 |
| Mode M0 | |||
|---|---|---|---|
| Quadrant | BADHDUFLAG | Total packets | Discarded packets |
| A | 0 | 200870 | 0 |
| B | 0 | 213724 | 0 |
| C | 0 | 200119 | 0 |
| D | 0 | 201137 | 0 |
| Quadrant | Total seconds | Saturated seconds | Saturation percentage |
|---|---|---|---|
| A | 95162 | 1418 | 1.490091% |
| B | 95162 | 2198 | 2.309745% |
| C | 95162 | 1725 | 1.812698% |
| D | 95162 | 944 | 0.991993% |
Noise dominated data is calculated using 1-second bins in cleaned event files. If a bin has >2000 counts, and if more than 50% of those come from <1% of pixels, then it is considered to be noise-dominated and hence unusable.
| Quadrant | # 1 sec bins | Bins with >0 counts | Bins with >2000 counts | High rate bins dominated by noise | Noise dominated (total time) | Noise dominated (detector-on time) | Marked lightcurve |
|---|---|---|---|---|---|---|---|
| A | 109233 | 95154 | 73 | 73 | 0.07% | 0.08% |  |
| B | 109233 | 95152 | 250 | 250 | 0.23% | 0.26% |  |
| C | 109233 | 95154 | 10 | 10 | 0.01% | 0.01% |  |
| D | 109233 | 95156 | 14 | 14 | 0.01% | 0.01% |  |
Top three noisy pixels from each quadrant. If the there are fewer than three noisy pixels in the level2.evt file, extra rows are filled as -1
| Pixel properties | Quadrant properties | ||||||
|---|---|---|---|---|---|---|---|
| Quadrant | DetID | PixID | Counts | Sigma | Mean | Median | Sigma |
| A | 15 | 239 | 734287 | 671.7 | 4954 | 4848 | 1086.0 |
| A | 9 | 143 | 156992 | 140.1 | 4954 | 4848 | 1086.0 |
| A | 13 | 210 | 115536 | 101.93 | 4954 | 4848 | 1086.0 |
| B | 10 | 245 | 1581916 | 1658.91 | 4991 | 4855 | 950.7 |
| B | 5 | 65 | 861778 | 901.4 | 4991 | 4855 | 950.7 |
| B | 15 | 222 | 456618 | 475.21 | 4991 | 4855 | 950.7 |
| C | 3 | 233 | 619966 | 556.55 | 4743 | 4715 | 1105.5 |
| C | 9 | 236 | 588775 | 528.34 | 4743 | 4715 | 1105.5 |
| C | 7 | 247 | 85710 | 73.27 | 4743 | 4715 | 1105.5 |
| D | 12 | 110 | 1152742 | 1031.41 | 4846 | 4669 | 1113.1 |
| D | 2 | 152 | 387528 | 343.95 | 4846 | 4669 | 1113.1 |
| D | 2 | 234 | 371270 | 329.35 | 4846 | 4669 | 1113.1 |
Histogram calculated using DETX and DETY for each event in the final _common_clean file
| Quadrant A |  |
 |
Quadrant B |
|---|---|---|---|
| Quadrant D |  |
 |
Quadrant C |
| Plot type | Count rate plots | Images |
|---|---|---|
| Comparison with Poisson distribution Blue bars denote a histogram of data divided into 1 sec bins. Red curve is a Poisson curve with rate = median count rate of data. |
 |
 |
| Quadrant-wise count rates Data is divided into 100 sec bins |
 |
|
| Module-wise count rates for Quadrant A Data is divided into 100 sec bins |
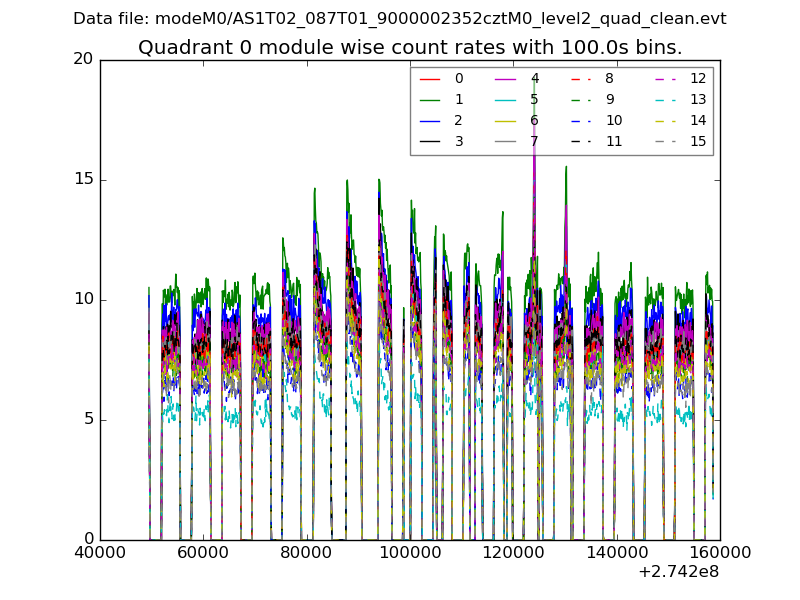 |
 |
| Module-wise count rates for Quadrant B Data is divided into 100 sec bins |
 |
 |
| Module-wise count rates for Quadrant C Data is divided into 100 sec bins |
 |
 |
| Module-wise count rates for Quadrant D Data is divided into 100 sec bins |
 |
 |
| Parameter | Plot |
|---|---|
| CZT HV Monitor |  |
| D_VDD |  |
| Temperature 1 |  |
| Veto HV Monitor |  |
| Veto LLD |  |
| Alpha Counter |  |
| _CPM_Rate | 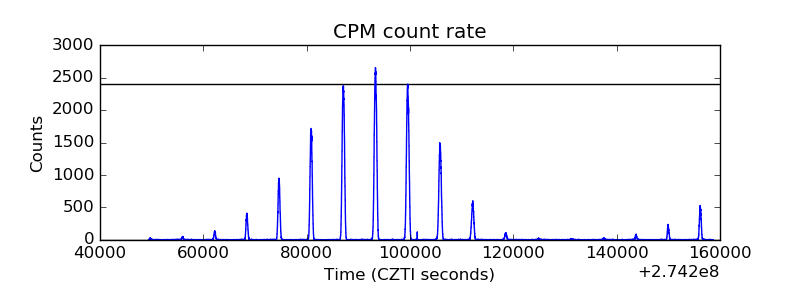 |
| CZT Counter | 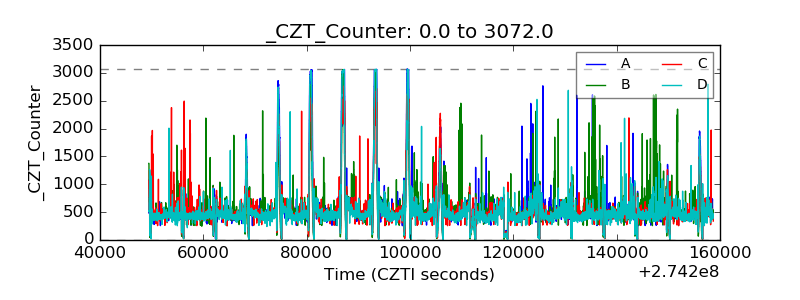 |
| +2.5 Volts monitor |  |
| +5 Volts monitor |  |
| _ROLL_ROT |  |
| _Roll_DEC |  |
| _Roll_RA |  |
| Veto Counter |  |