| Param | Original file | Final file |
|---|---|---|
| Filename | modeM0/AS1G08_081T01_9000002350cztM0_level2_bc.evt | modeM0/AS1G08_081T01_9000002350cztM0_level2_quad_clean.evt |
| Size (bytes) | 2,009,629,440 | 877,230,720 |
| Size | 1.9 GB | 836.6 MB |
| Events in quadrant A | 14,100,408 | 5,616,348 |
| Events in quadrant B | 14,803,976 | 5,699,060 |
| Events in quadrant C | 13,369,090 | 5,467,560 |
| Events in quadrant D | 14,206,732 | 5,384,041 |
| Mode M0 | |||
|---|---|---|---|
| Quadrant | BADHDUFLAG | Total packets | Discarded packets |
| A | 0 | 136486 | 0 |
| B | 0 | 137922 | 0 |
| C | 0 | 134838 | 0 |
| D | 0 | 135629 | 0 |
| Mode M9 | |||
|---|---|---|---|
| Quadrant | BADHDUFLAG | Total packets | Discarded packets |
| A | 0 | 113 | 0 |
| B | 0 | 113 | 0 |
| C | 0 | 113 | 0 |
| D | 0 | 113 | 0 |
| Mode SS | |||
|---|---|---|---|
| Quadrant | BADHDUFLAG | Total packets | Discarded packets |
| A | 0 | 1306 | 0 |
| B | 0 | 1306 | 0 |
| C | 0 | 1306 | 0 |
| D | 0 | 1306 | 0 |
| Quadrant | Total seconds | Saturated seconds | Saturation percentage |
|---|---|---|---|
| A | 64238 | 803 | 1.250039% |
| B | 64238 | 983 | 1.530247% |
| C | 64238 | 1052 | 1.637660% |
| D | 64238 | 586 | 0.912233% |
Noise dominated data is calculated using 1-second bins in cleaned event files. If a bin has >2000 counts, and if more than 50% of those come from <1% of pixels, then it is considered to be noise-dominated and hence unusable.
| Quadrant | # 1 sec bins | Bins with >0 counts | Bins with >2000 counts | High rate bins dominated by noise | Noise dominated (total time) | Noise dominated (detector-on time) | Marked lightcurve |
|---|---|---|---|---|---|---|---|
| A | 75449 | 64239 | 13 | 13 | 0.02% | 0.02% |  |
| B | 75449 | 64234 | 7 | 7 | 0.01% | 0.01% |  |
| C | 75449 | 64237 | 7 | 7 | 0.01% | 0.01% | 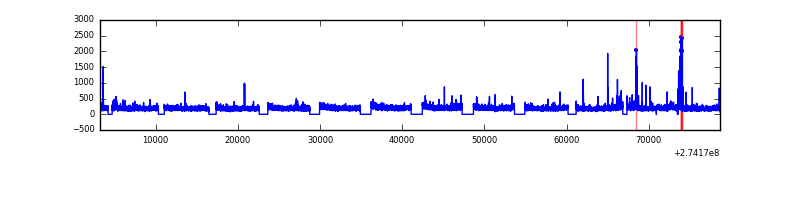 |
| D | 75449 | 64235 | 78 | 78 | 0.10% | 0.12% |  |
Top three noisy pixels from each quadrant. If the there are fewer than three noisy pixels in the level2.evt file, extra rows are filled as -1
| Pixel properties | Quadrant properties | ||||||
|---|---|---|---|---|---|---|---|
| Quadrant | DetID | PixID | Counts | Sigma | Mean | Median | Sigma |
| A | 13 | 210 | 617847 | 840.28 | 3374 | 3316 | 731.3 |
| A | 15 | 239 | 458867 | 622.9 | 3374 | 3316 | 731.3 |
| A | 13 | 34 | 58950 | 76.07 | 3374 | 3316 | 731.3 |
| B | 4 | 173 | 362344 | 568.51 | 3409 | 3325 | 631.5 |
| B | 5 | 65 | 329875 | 517.09 | 3409 | 3325 | 631.5 |
| B | 0 | 189 | 261486 | 408.8 | 3409 | 3325 | 631.5 |
| C | 3 | 233 | 389807 | 502.99 | 3282 | 3269 | 768.5 |
| C | 9 | 236 | 242773 | 311.66 | 3282 | 3269 | 768.5 |
| C | 0 | 207 | 48293 | 58.59 | 3282 | 3269 | 768.5 |
| D | 13 | 104 | 461177 | 599.93 | 3345 | 3234 | 763.3 |
| D | 2 | 234 | 292010 | 378.31 | 3345 | 3234 | 763.3 |
| D | 2 | 152 | 146113 | 187.18 | 3345 | 3234 | 763.3 |
Histogram calculated using DETX and DETY for each event in the final _common_clean file
| Quadrant A | 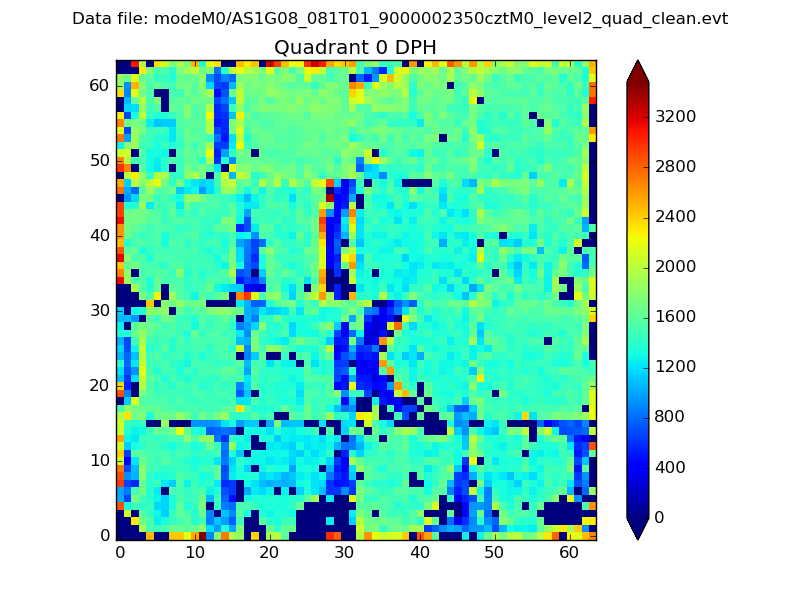 |
 |
Quadrant B |
|---|---|---|---|
| Quadrant D |  |
 |
Quadrant C |
| Plot type | Count rate plots | Images |
|---|---|---|
| Comparison with Poisson distribution Blue bars denote a histogram of data divided into 1 sec bins. Red curve is a Poisson curve with rate = median count rate of data. |
 |
 |
| Quadrant-wise count rates Data is divided into 100 sec bins |
 |
|
| Module-wise count rates for Quadrant A Data is divided into 100 sec bins |
 |
 |
| Module-wise count rates for Quadrant B Data is divided into 100 sec bins |
 |
 |
| Module-wise count rates for Quadrant C Data is divided into 100 sec bins |
 |
 |
| Module-wise count rates for Quadrant D Data is divided into 100 sec bins |
 |
 |
| Parameter | Plot |
|---|---|
| CZT HV Monitor |  |
| D_VDD |  |
| Temperature 1 | 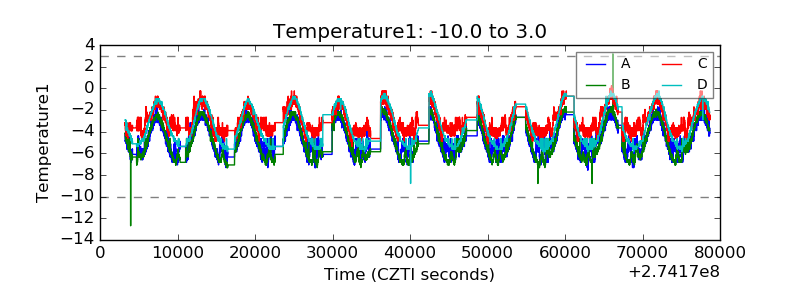 |
| Veto HV Monitor | 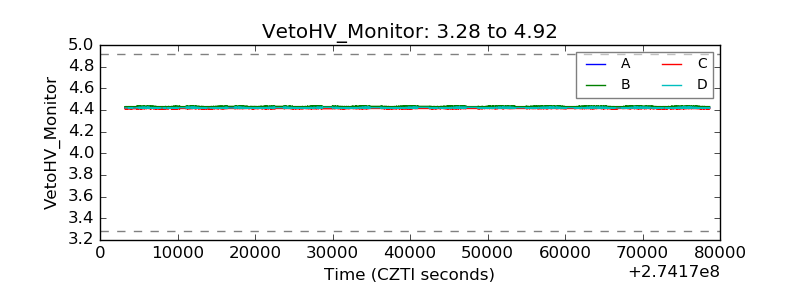 |
| Veto LLD |  |
| Alpha Counter |  |
| _CPM_Rate |  |
| CZT Counter |  |
| +2.5 Volts monitor |  |
| +5 Volts monitor |  |
| _ROLL_ROT | 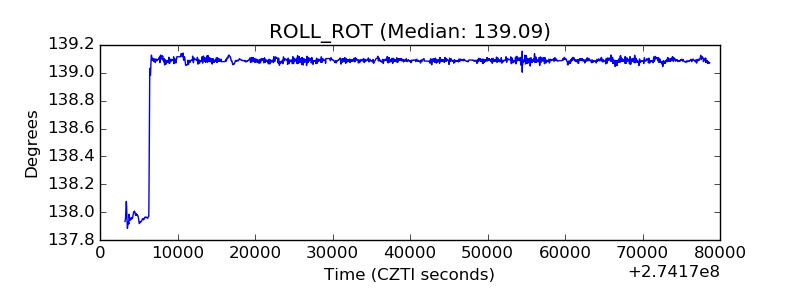 |
| _Roll_DEC |  |
| _Roll_RA | 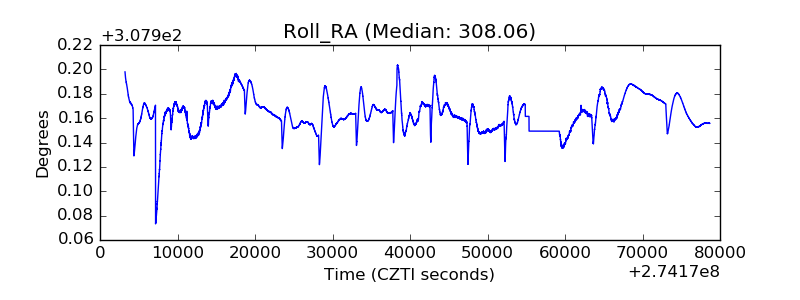 |
| Veto Counter |  |