| Param | Original file | Final file |
|---|---|---|
| Filename | modeM0/AS1G08_066T02_9000002346cztM0_level2_bc.evt | modeM0/AS1G08_066T02_9000002346cztM0_level2_quad_clean.evt |
| Size (bytes) | 953,265,600 | 351,342,720 |
| Size | 909.1 MB | 335.1 MB |
| Events in quadrant A | 7,983,962 | 2,139,853 |
| Events in quadrant B | 6,477,674 | 2,212,191 |
| Events in quadrant C | 6,249,246 | 2,101,249 |
| Events in quadrant D | 6,057,563 | 2,075,350 |
| Mode M0 | |||
|---|---|---|---|
| Quadrant | BADHDUFLAG | Total packets | Discarded packets |
| A | 0 | 68096 | 0 |
| B | 0 | 64556 | 0 |
| C | 0 | 63631 | 0 |
| D | 0 | 63459 | 0 |
| Mode SS | |||
|---|---|---|---|
| Quadrant | BADHDUFLAG | Total packets | Discarded packets |
| A | 0 | 622 | 0 |
| B | 0 | 622 | 0 |
| C | 0 | 622 | 0 |
| D | 0 | 622 | 0 |
| Mode M9 | |||
|---|---|---|---|
| Quadrant | BADHDUFLAG | Total packets | Discarded packets |
| A | 0 | 16 | 0 |
| B | 0 | 16 | 0 |
| C | 0 | 16 | 0 |
| D | 0 | 16 | 0 |
| Quadrant | Total seconds | Saturated seconds | Saturation percentage |
|---|---|---|---|
| A | 30724 | 645 | 2.099336% |
| B | 30724 | 624 | 2.030986% |
| C | 30724 | 652 | 2.122120% |
| D | 30724 | 446 | 1.451634% |
Noise dominated data is calculated using 1-second bins in cleaned event files. If a bin has >2000 counts, and if more than 50% of those come from <1% of pixels, then it is considered to be noise-dominated and hence unusable.
| Quadrant | # 1 sec bins | Bins with >0 counts | Bins with >2000 counts | High rate bins dominated by noise | Noise dominated (total time) | Noise dominated (detector-on time) | Marked lightcurve |
|---|---|---|---|---|---|---|---|
| A | 32410 | 30727 | 2 | 2 | 0.01% | 0.01% |  |
| B | 32410 | 30727 | 5 | 5 | 0.02% | 0.02% |  |
| C | 32410 | 30726 | 0 | 0 | 0.00% | 0.00% | 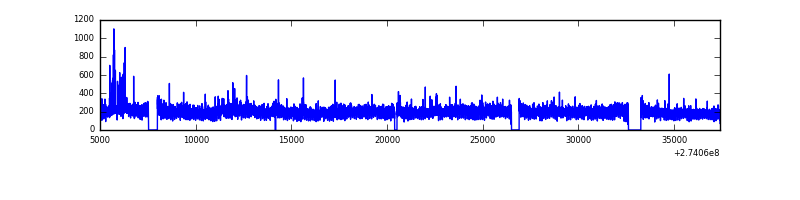 |
| D | 32410 | 30723 | 1 | 1 | 0.00% | 0.00% |  |
Top three noisy pixels from each quadrant. If the there are fewer than three noisy pixels in the level2.evt file, extra rows are filled as -1
| Pixel properties | Quadrant properties | ||||||
|---|---|---|---|---|---|---|---|
| Quadrant | DetID | PixID | Counts | Sigma | Mean | Median | Sigma |
| A | 15 | 239 | 2125142 | 6389.63 | 1511 | 1474 | 332.4 |
| A | 15 | 174 | 18250 | 50.47 | 1511 | 1474 | 332.4 |
| A | 9 | 143 | 18035 | 49.83 | 1511 | 1474 | 332.4 |
| B | 0 | 189 | 142234 | 481.48 | 1539 | 1498 | 292.3 |
| B | 4 | 173 | 88419 | 297.37 | 1539 | 1498 | 292.3 |
| B | 4 | 216 | 85085 | 285.97 | 1539 | 1498 | 292.3 |
| C | 3 | 233 | 489743 | 1408.54 | 1472 | 1453 | 346.7 |
| C | 7 | 247 | 65000 | 183.31 | 1472 | 1453 | 346.7 |
| C | 0 | 207 | 15253 | 39.81 | 1472 | 1453 | 346.7 |
| D | 2 | 234 | 117772 | 329.04 | 1508 | 1447 | 353.5 |
| D | 2 | 152 | 60158 | 166.07 | 1508 | 1447 | 353.5 |
| D | 13 | 172 | 57622 | 158.9 | 1508 | 1447 | 353.5 |
Histogram calculated using DETX and DETY for each event in the final _common_clean file
| Quadrant A |  |
 |
Quadrant B |
|---|---|---|---|
| Quadrant D |  |
 |
Quadrant C |
| Plot type | Count rate plots | Images |
|---|---|---|
| Comparison with Poisson distribution Blue bars denote a histogram of data divided into 1 sec bins. Red curve is a Poisson curve with rate = median count rate of data. |
 |
 |
| Quadrant-wise count rates Data is divided into 100 sec bins |
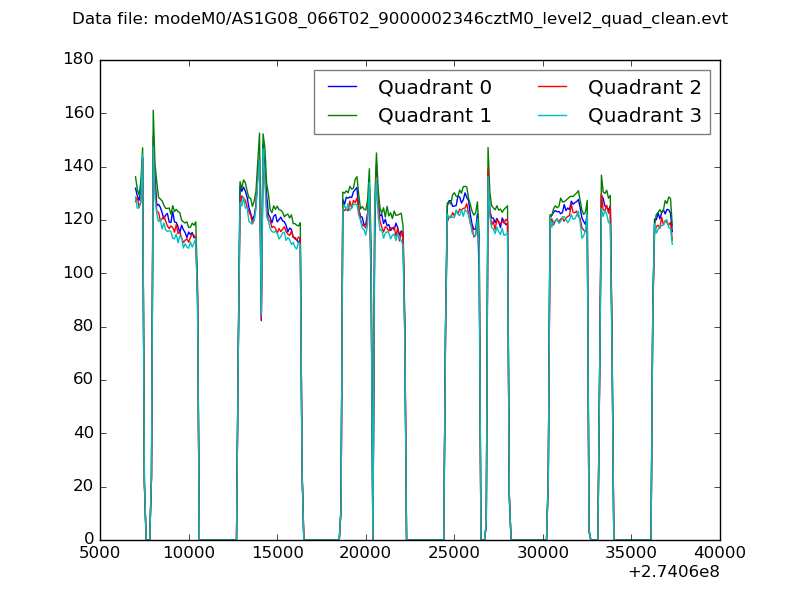 |
|
| Module-wise count rates for Quadrant A Data is divided into 100 sec bins |
 |
 |
| Module-wise count rates for Quadrant B Data is divided into 100 sec bins |
 |
 |
| Module-wise count rates for Quadrant C Data is divided into 100 sec bins |
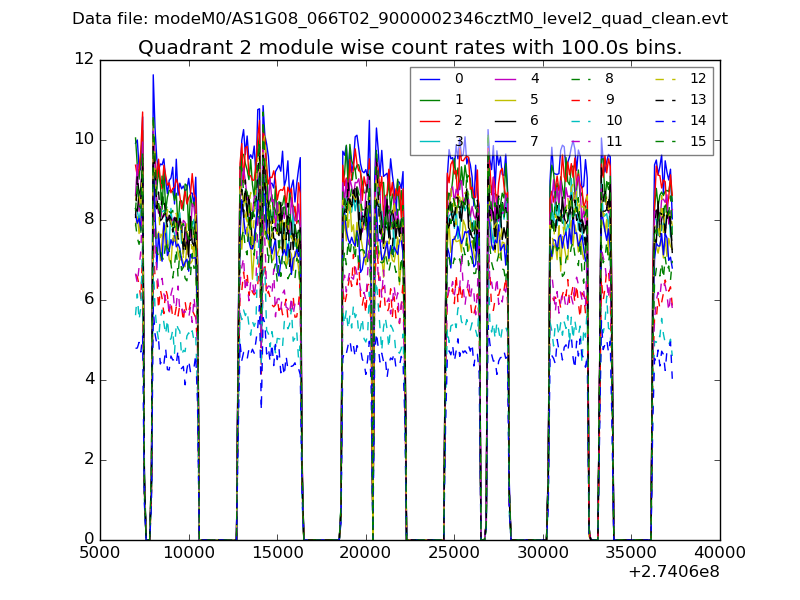 |
 |
| Module-wise count rates for Quadrant D Data is divided into 100 sec bins |
 |
 |
| Parameter | Plot |
|---|---|
| CZT HV Monitor | 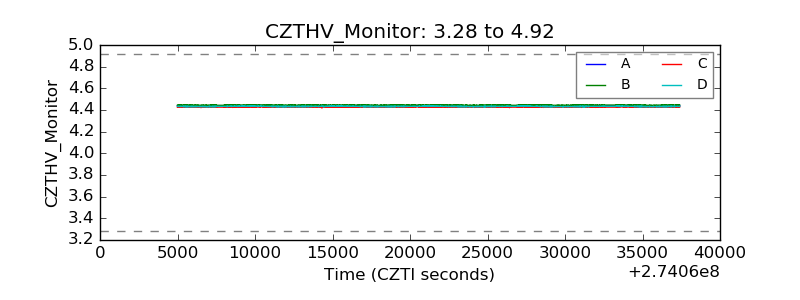 |
| D_VDD |  |
| Temperature 1 |  |
| Veto HV Monitor |  |
| Veto LLD |  |
| Alpha Counter |  |
| _CPM_Rate |  |
| CZT Counter |  |
| +2.5 Volts monitor |  |
| +5 Volts monitor | 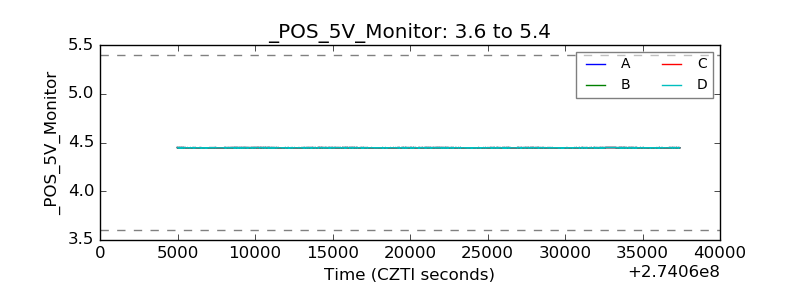 |
| _ROLL_ROT |  |
| _Roll_DEC |  |
| _Roll_RA |  |
| Veto Counter | 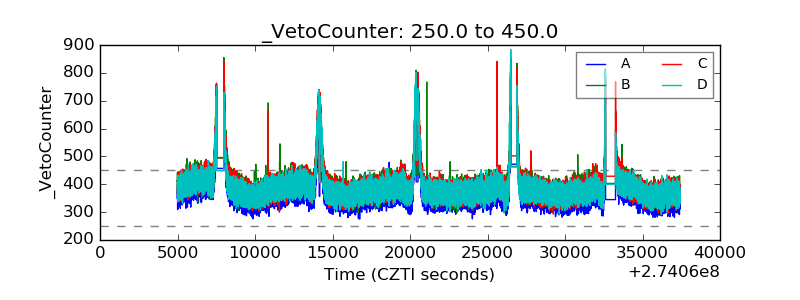 |