| Param | Original file | Final file |
|---|---|---|
| Filename | modeM0/AS1A04_104T03_9000002348cztM0_level2_bc.evt | modeM0/AS1A04_104T03_9000002348cztM0_level2_quad_clean.evt |
| Size (bytes) | 2,008,316,160 | 814,366,080 |
| Size | 1.9 GB | 776.6 MB |
| Events in quadrant A | 13,984,998 | 5,166,264 |
| Events in quadrant B | 15,296,179 | 5,246,792 |
| Events in quadrant C | 13,355,716 | 5,012,269 |
| Events in quadrant D | 13,900,318 | 4,933,368 |
| Mode SS | |||
|---|---|---|---|
| Quadrant | BADHDUFLAG | Total packets | Discarded packets |
| A | 0 | 1276 | 0 |
| B | 0 | 1276 | 0 |
| C | 0 | 1276 | 0 |
| D | 0 | 1276 | 0 |
| Mode M9 | |||
|---|---|---|---|
| Quadrant | BADHDUFLAG | Total packets | Discarded packets |
| A | 0 | 109 | 0 |
| B | 0 | 109 | 0 |
| C | 0 | 109 | 0 |
| D | 0 | 109 | 0 |
| Mode M0 | |||
|---|---|---|---|
| Quadrant | BADHDUFLAG | Total packets | Discarded packets |
| A | 0 | 134186 | 0 |
| B | 0 | 138898 | 0 |
| C | 0 | 132694 | 0 |
| D | 0 | 132953 | 0 |
| Quadrant | Total seconds | Saturated seconds | Saturation percentage |
|---|---|---|---|
| A | 62833 | 886 | 1.410087% |
| B | 62833 | 1086 | 1.728391% |
| C | 62833 | 964 | 1.534226% |
| D | 62833 | 625 | 0.994700% |
Noise dominated data is calculated using 1-second bins in cleaned event files. If a bin has >2000 counts, and if more than 50% of those come from <1% of pixels, then it is considered to be noise-dominated and hence unusable.
| Quadrant | # 1 sec bins | Bins with >0 counts | Bins with >2000 counts | High rate bins dominated by noise | Noise dominated (total time) | Noise dominated (detector-on time) | Marked lightcurve |
|---|---|---|---|---|---|---|---|
| A | 72873 | 62828 | 36 | 36 | 0.05% | 0.06% |  |
| B | 72874 | 62829 | 12 | 12 | 0.02% | 0.02% | 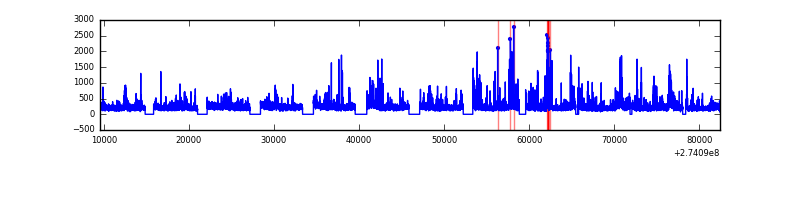 |
| C | 72873 | 62833 | 0 | 0 | 0.00% | 0.00% |  |
| D | 72873 | 62832 | 56 | 56 | 0.08% | 0.09% | 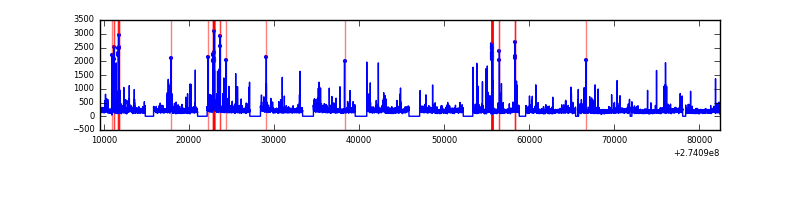 |
Top three noisy pixels from each quadrant. If the there are fewer than three noisy pixels in the level2.evt file, extra rows are filled as -1
| Pixel properties | Quadrant properties | ||||||
|---|---|---|---|---|---|---|---|
| Quadrant | DetID | PixID | Counts | Sigma | Mean | Median | Sigma |
| A | 15 | 239 | 992914 | 1390.7 | 3316 | 3253 | 711.6 |
| A | 13 | 34 | 142682 | 195.93 | 3316 | 3253 | 711.6 |
| A | 13 | 210 | 47287 | 61.88 | 3316 | 3253 | 711.6 |
| B | 10 | 245 | 637335 | 1016.9 | 3352 | 3267 | 623.5 |
| B | 4 | 142 | 353402 | 561.54 | 3352 | 3267 | 623.5 |
| B | 0 | 189 | 246471 | 390.04 | 3352 | 3267 | 623.5 |
| C | 3 | 233 | 1033908 | 1407.72 | 3177 | 3157 | 732.2 |
| C | 7 | 247 | 60108 | 77.78 | 3177 | 3157 | 732.2 |
| C | 0 | 207 | 29714 | 36.27 | 3177 | 3157 | 732.2 |
| D | 15 | 0 | 301293 | 404.43 | 3260 | 3149 | 737.2 |
| D | 2 | 234 | 271924 | 364.59 | 3260 | 3149 | 737.2 |
| D | 13 | 104 | 246662 | 330.32 | 3260 | 3149 | 737.2 |
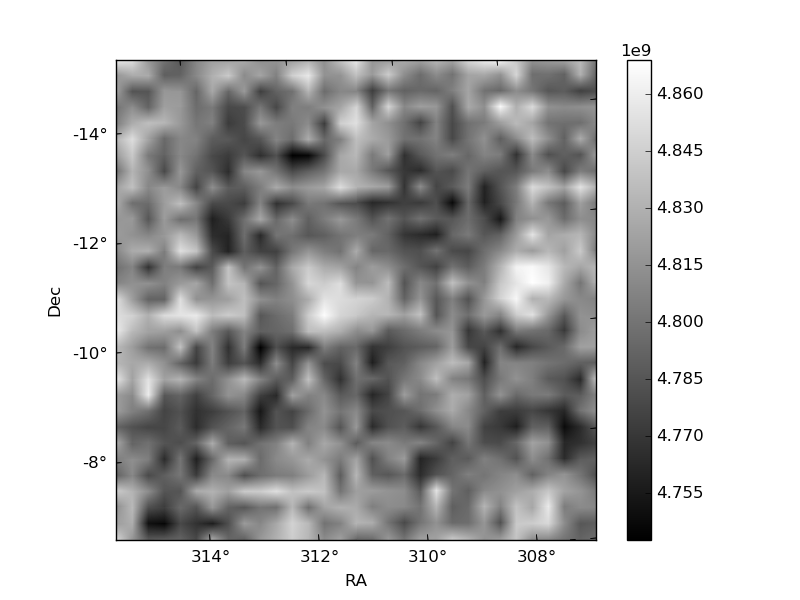
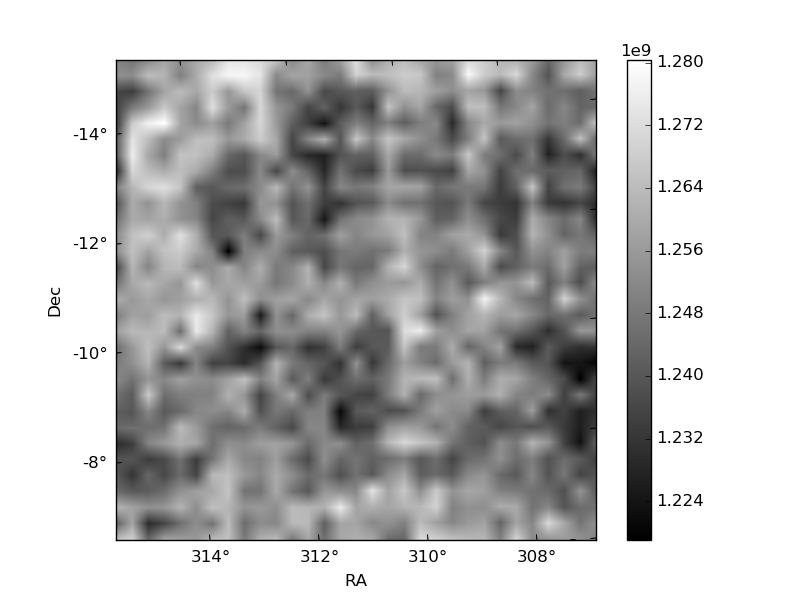
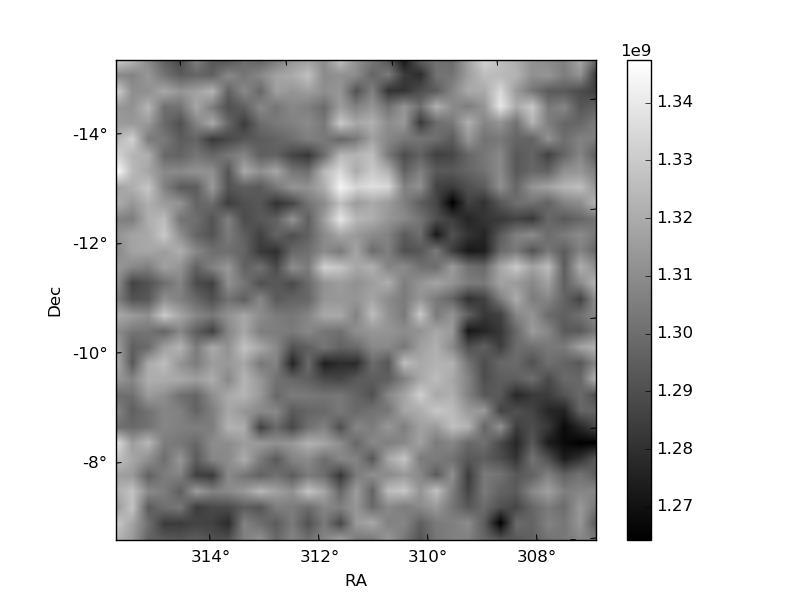
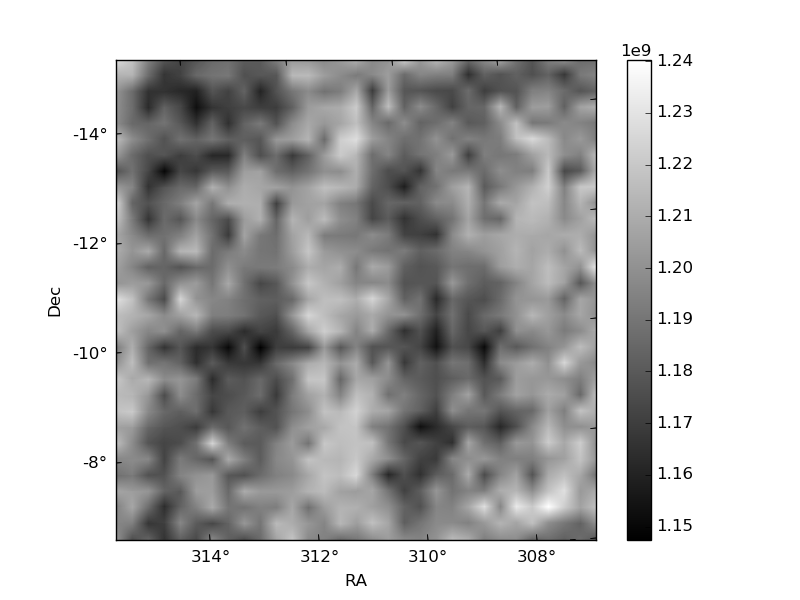
Histogram calculated using DETX and DETY for each event in the final _common_clean file
| Quadrant A |  |
 |
Quadrant B |
|---|---|---|---|
| Quadrant D |  |
 |
Quadrant C |
| Plot type | Count rate plots | Images |
|---|---|---|
| Comparison with Poisson distribution Blue bars denote a histogram of data divided into 1 sec bins. Red curve is a Poisson curve with rate = median count rate of data. |
 |
 |
| Quadrant-wise count rates Data is divided into 100 sec bins |
 |
|
| Module-wise count rates for Quadrant A Data is divided into 100 sec bins |
 |
 |
| Module-wise count rates for Quadrant B Data is divided into 100 sec bins |
 |
 |
| Module-wise count rates for Quadrant C Data is divided into 100 sec bins |
 |
 |
| Module-wise count rates for Quadrant D Data is divided into 100 sec bins |
 |
 |
| Parameter | Plot |
|---|---|
| CZT HV Monitor |  |
| D_VDD | 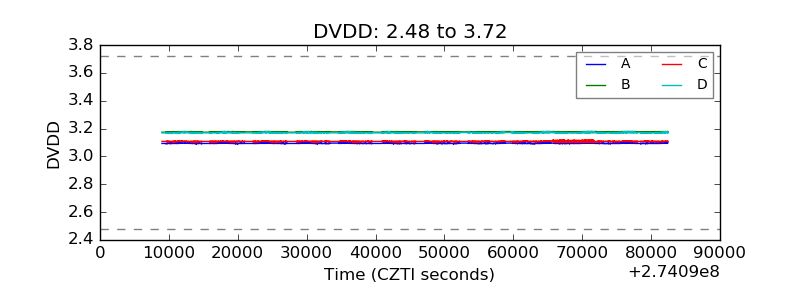 |
| Temperature 1 |  |
| Veto HV Monitor | 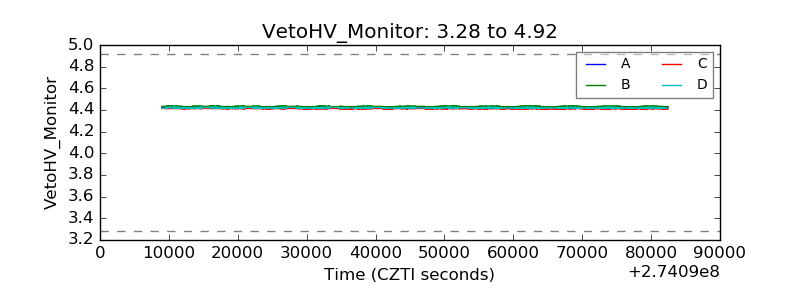 |
| Veto LLD | 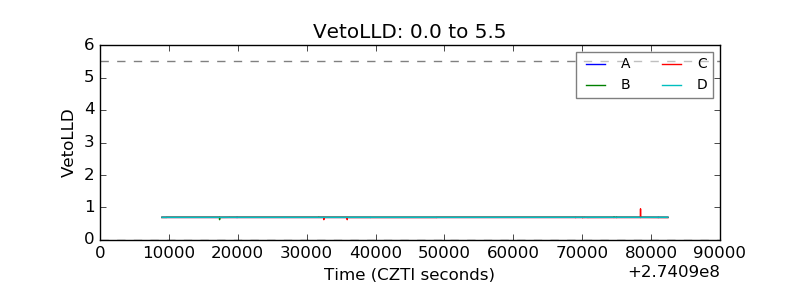 |
| Alpha Counter |  |
| _CPM_Rate |  |
| CZT Counter |  |
| +2.5 Volts monitor |  |
| +5 Volts monitor |  |
| _ROLL_ROT |  |
| _Roll_DEC |  |
| _Roll_RA |  |
| Veto Counter |  |