| Param | Original file | Final file |
|---|---|---|
| Filename | modeM0/AS1A04_143T01_9000002344cztM0_level2.fits | modeM0/AS1A04_143T01_9000002344cztM0_level2_quad_clean.evt |
| Size (bytes) | 4,767,592,320 | 4,629,389,760 |
| Size | 4.4 GB | 4.3 GB |
| Events in quadrant A | 28,549,934 | 27,178,725 |
| Events in quadrant B | 28,298,820 | 28,379,192 |
| Events in quadrant C | 28,818,376 | 26,543,991 |
| Events in quadrant D | 25,000,122 | 24,400,121 |
| Mode SS | |||
|---|---|---|---|
| Quadrant | BADHDUFLAG | Total packets | Discarded packets |
| A | 0 | 10046 | 0 |
| B | 0 | 10038 | 0 |
| C | 0 | 10040 | 0 |
| D | 0 | 10044 | 0 |
| Mode M0 | |||
|---|---|---|---|
| Quadrant | BADHDUFLAG | Total packets | Discarded packets |
| A | 0 | 1226050 | 0 |
| B | 0 | 1069972 | 0 |
| C | 0 | 1045156 | 0 |
| D | 0 | 1088211 | 0 |
| Mode M9 | |||
|---|---|---|---|
| Quadrant | BADHDUFLAG | Total packets | Discarded packets |
| A | 0 | 821 | 0 |
| B | 0 | 821 | 0 |
| C | 0 | 821 | 0 |
| D | 0 | 821 | 0 |
| Quadrant | Total seconds | Saturated seconds | Saturation percentage |
|---|---|---|---|
| A | 492232 | 22691 | 4.609818% |
| B | 492161 | 8975 | 1.823590% |
| C | 492224 | 9234 | 1.875975% |
| D | 492205 | 11657 | 2.368322% |
Noise dominated data is calculated using 1-second bins in cleaned event files. If a bin has >2000 counts, and if more than 50% of those come from <1% of pixels, then it is considered to be noise-dominated and hence unusable.
| Quadrant | # 1 sec bins | Bins with >0 counts | Bins with >2000 counts | High rate bins dominated by noise | Noise dominated (total time) | Noise dominated (detector-on time) | Marked lightcurve |
|---|---|---|---|---|---|---|---|
| A | 614993 | 492251 | 0 | 0 | 0.00% | 0.00% |  |
| B | 614993 | 492560 | 0 | 0 | 0.00% | 0.00% | 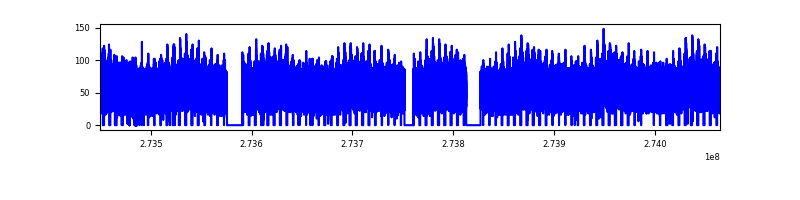 |
| C | 614993 | 492604 | 0 | 0 | 0.00% | 0.00% |  |
| D | 614993 | 492363 | 0 | 0 | 0.00% | 0.00% |  |
Top three noisy pixels from each quadrant. If the there are fewer than three noisy pixels in the level2.evt file, extra rows are filled as -1
| Pixel properties | Quadrant properties | ||||||
|---|---|---|---|---|---|---|---|
| Quadrant | DetID | PixID | Counts | Sigma | Mean | Median | Sigma |
| A | 0 | 29 | 27132 | 11.11 | 7436 | 6971 | 1815.0 |
| A | 7 | 110 | 22813 | 8.73 | 7436 | 6971 | 1815.0 |
| A | 0 | 30 | 21417 | 7.96 | 7436 | 6971 | 1815.0 |
| B | 2 | 9 | 22976 | 10.83 | 7486 | 7132 | 1462.3 |
| B | 2 | 8 | 19372 | 8.37 | 7486 | 7132 | 1462.3 |
| B | 3 | 17 | 18847 | 8.01 | 7486 | 7132 | 1462.3 |
| C | 1 | 80 | 21720 | 7.56 | 7609 | 7093 | 1933.8 |
| C | 1 | 81 | 21528 | 7.46 | 7609 | 7093 | 1933.8 |
| C | 12 | 241 | 19969 | 6.66 | 7609 | 7093 | 1933.8 |
| D | 3 | 14 | 18183 | 6.19 | 7146 | 6494 | 1887.7 |
| D | 6 | 231 | 18044 | 6.12 | 7146 | 6494 | 1887.7 |
| D | 7 | 3 | 17349 | 5.75 | 7146 | 6494 | 1887.7 |
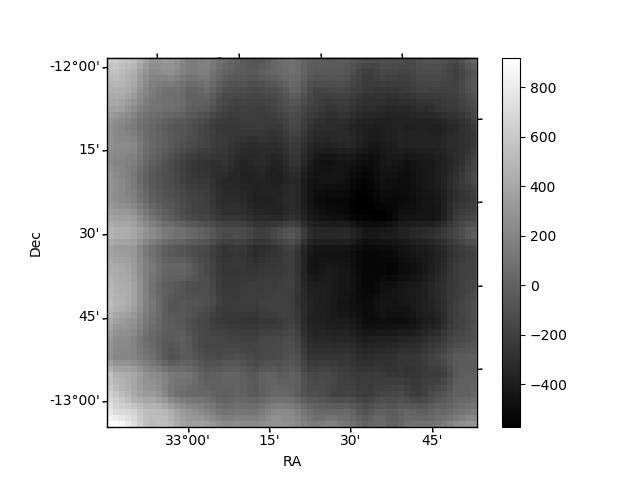
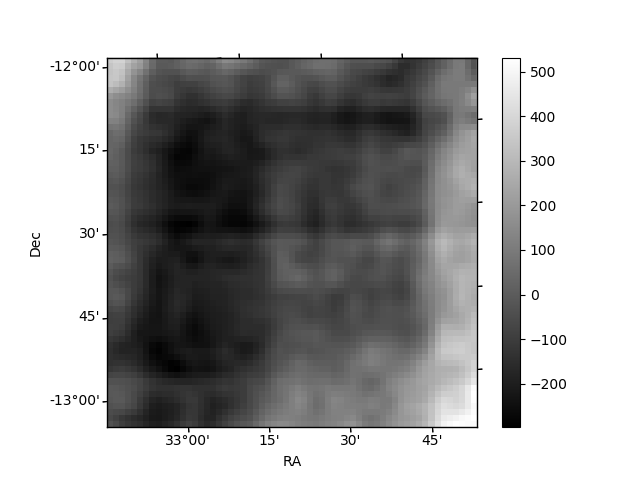
Histogram calculated using DETX and DETY for each event in the final _common_clean file
| Quadrant A |  |
 |
Quadrant B |
|---|---|---|---|
| Quadrant D |  |
 |
Quadrant C |
| Plot type | Count rate plots | Images |
|---|---|---|
| Comparison with Poisson distribution Blue bars denote a histogram of data divided into 1 sec bins. Red curve is a Poisson curve with rate = median count rate of data. |
 |
 |
| Quadrant-wise count rates Data is divided into 100 sec bins |
 |
|
| Module-wise count rates for Quadrant A Data is divided into 100 sec bins |
 |
 |
| Module-wise count rates for Quadrant B Data is divided into 100 sec bins |
 |
 |
| Module-wise count rates for Quadrant C Data is divided into 100 sec bins |
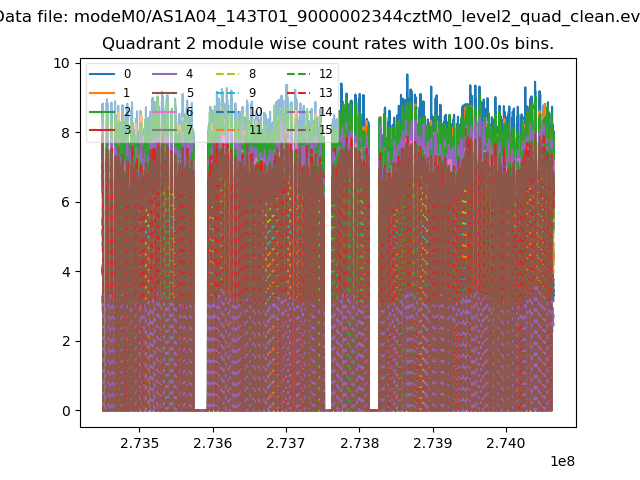 |
 |
| Module-wise count rates for Quadrant D Data is divided into 100 sec bins |
 |
 |
| Parameter | Plot |
|---|---|
| CZT HV Monitor | 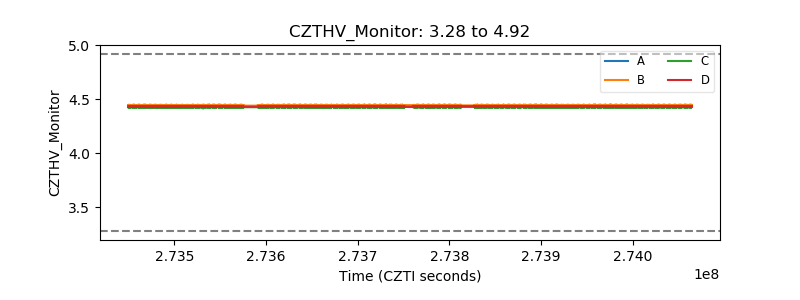 |
| D_VDD |  |
| Temperature 1 |  |
| Veto HV Monitor | 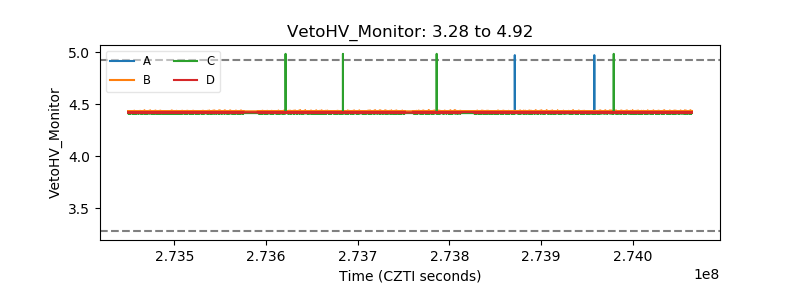 |
| Veto LLD |  |
| Alpha Counter | 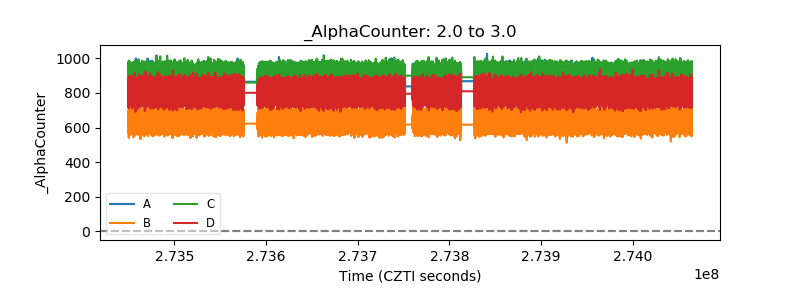 |
| _CPM_Rate |  |
| CZT Counter | 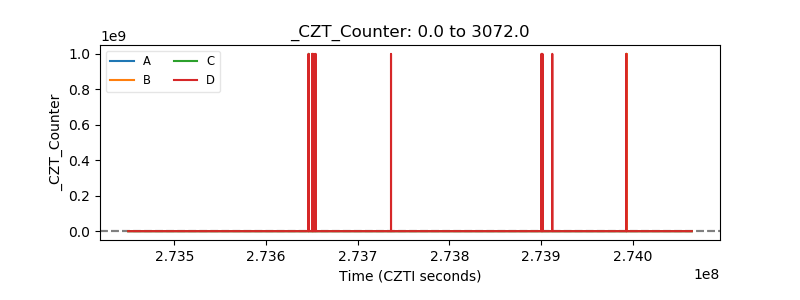 |
| +2.5 Volts monitor | 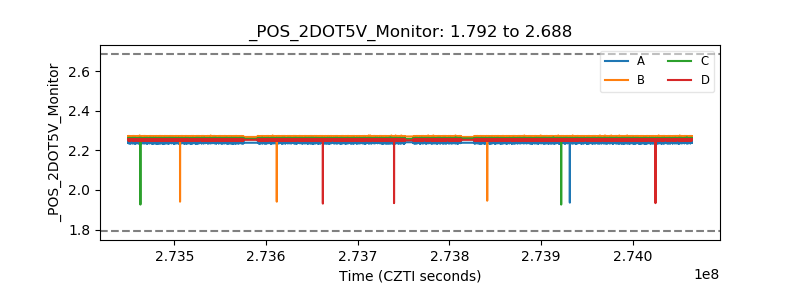 |
| +5 Volts monitor | 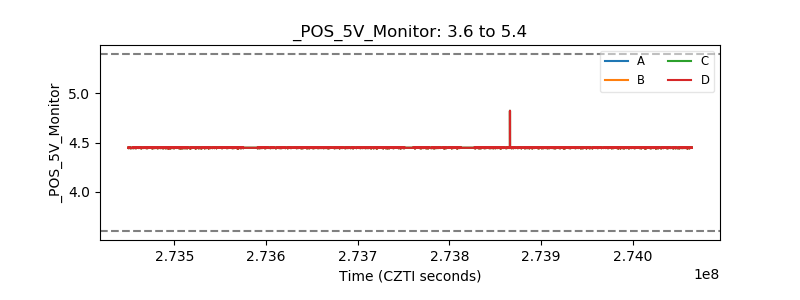 |
| _ROLL_ROT |  |
| _Roll_DEC |  |
| _Roll_RA | 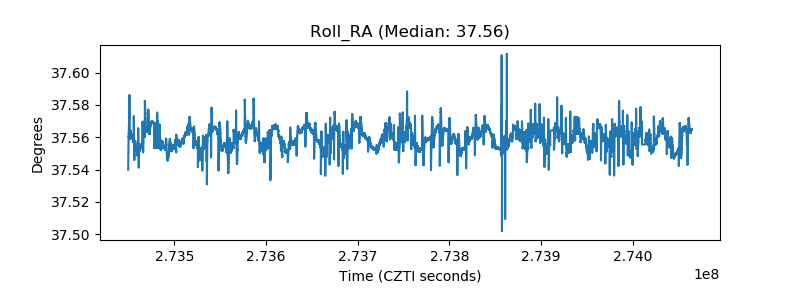 |
| Veto Counter | 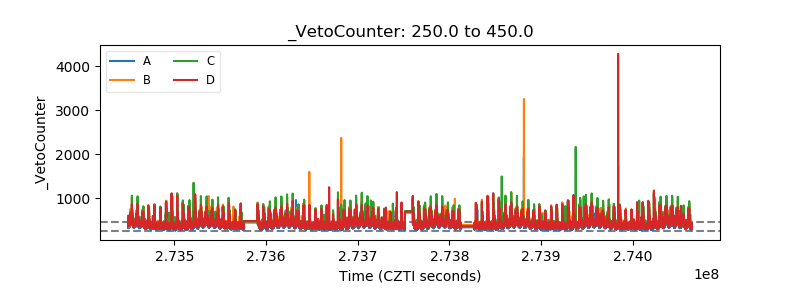 |